
by Stephen Fisher and Jake Dibden, 26th June 2024
Seat projections for the Conservatives at next week’s general election range from really bad to totally dire. Given recent polls, traditional uniform-change projections suggest the Conservatives will win just around 190 seats. On average the Multilevel Regression and Poststratification (MRP) models suggest the Tories will win less than 100 seats.
The main difference between them is that the MRP models estimate that the Conservative vote has dropped more where the party was stronger in 2019. That is to say, the drop is broadly proportional to prior strength rather than uniform (the same) across all constituencies.
Some MRP models and other forecasters have come unstuck in the past by predicting proportional change when uniform change predictions have been a better guide to seat tallies for the big parties in the post-war period (see Appendices of the Nuffield Election Studies). The efficacy of uniform change projections was so well established that they became the basis of the swingometer for election night programmes.
Since past vote choice is such a strong predictor of future vote choice, MRP models in effect have a 2019-2024 vote-transition matrix model at the heart of them. That in turn means MRP models tend to project proportional drops for parties in decline. The MRP modellers need a lot of data across constituencies and careful modelling to identify any counter-balancing pattern towards uniform change at the constituency level.
Are we likely to see predictions of proportional change come unstuck again this year?
The polls put the Conservatives down 24 points on the 45% they achieved in 2019. There are 102 constituencies in Britain where the Conservatives did not win 24% of the vote in 2019 (according to notional results for the new constituency boundaries).
Without as much as 24% to lose, the drop in the Conservative vote will have to be smaller in those seats.
But 102 is just 16% of the 631 constituencies in Britain the Conservatives contested last time. There are 528 places where the Conservatives are standing next week where they are notionally defending more than 24% of the vote.
Perhaps then the Conservatives will lose somewhat less than 24 points in the small minority of places where they cannot lose that much, and a bit more than 24 in the vast majority of other places, and things will average out. That is to say perhaps the drop in the vote will mainly be uniform, with the relatively small exception of where they did particularly badly last time.
That is roughly what happened in 1997 when the Conservatives last lost power. In the graph below each grey circle represents a constituency. Back then their vote dropped by 11 points from 1992 to 1997. If that had been the same in all constituencies then all the circles would have been on the horizontal “Uniform change” line. If, instead, the Tories had lost 26% of their 1992 vote in every constituency (as they did on average), then all the circles would have been on the downward sloping “Proportional change” line. The blue line is a curvilinear smoother (based on median splines) showing the average pattern of change with respect to prior strength.
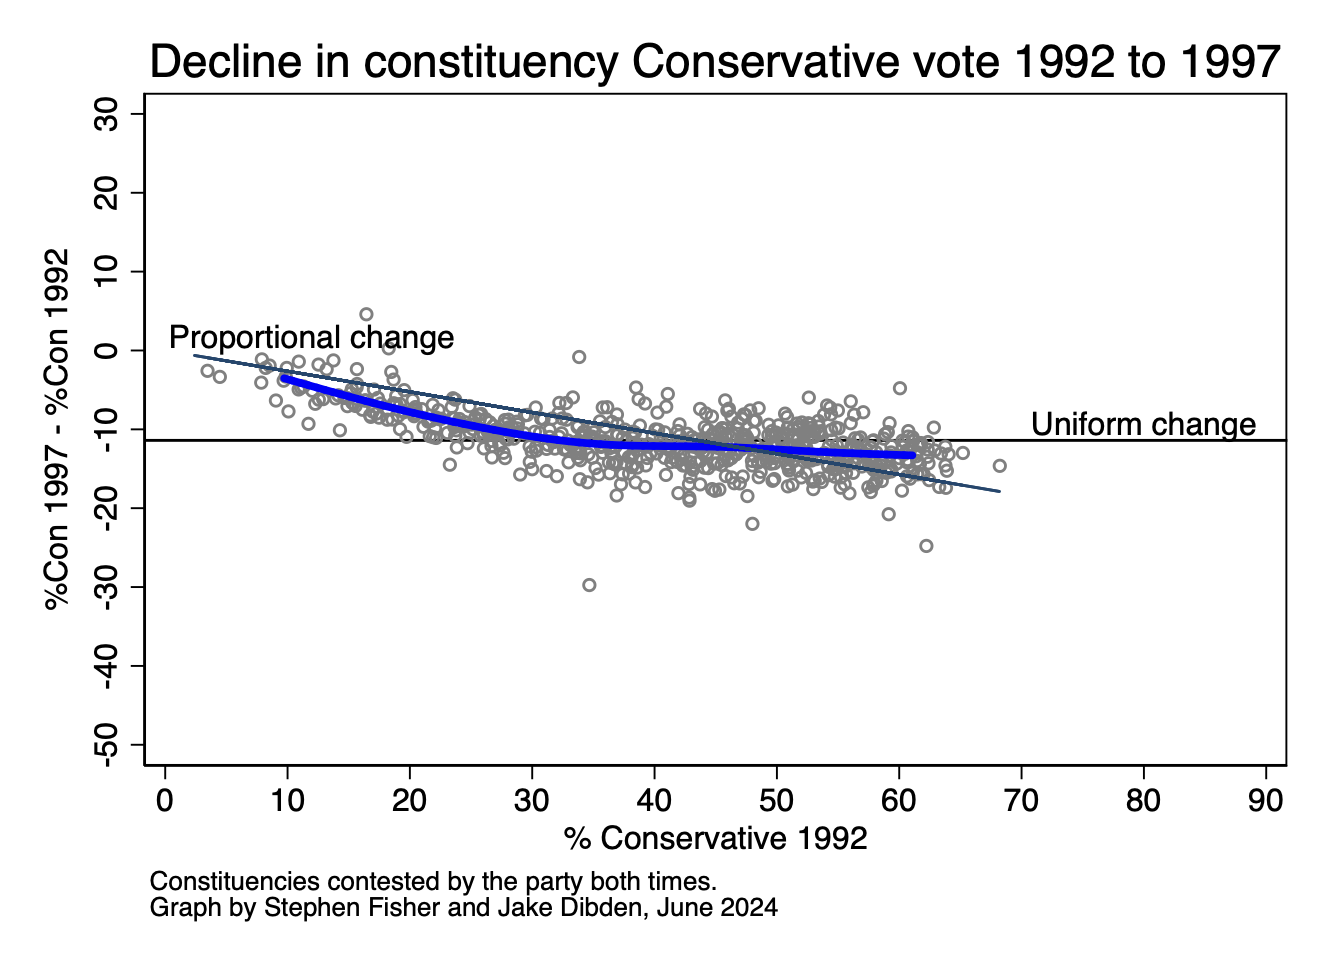
For most of the constituencies, the blue line shows that the average drop in the Conservative vote was fairly flat (that is uniform), but their vote did not drop so much where they started off with less than 25% of the vote. Crucially for the Conservatives, in their strongest seats the change was substantially less than they would have lost had the drop been proportional to prior strength.
Even though the Conservatives lost 171 seats in 1997 (including 43 beyond uniform change projections largely due to tactical switching), the Tories might have lost even more had their vote dropped proportionally in their safest seats.
If the pattern of Conservative decline next week is as uniform as it was in 1997 then the MRP predictions with the most proportional pattern of change and lowest predictions for the Conservatives will be most wrong.
To what extent is the 1997 pattern typical of parties that lose heavily?
Here we consider instances in Britain, and one from Canada, where a party’s vote has dropped by at least 9 percentage points. There is no graph for UKIP, which dropped from 13% in 2015 to 2% in 2017. Such an overwhelming collapse inevitably produces proportional change. The collapse of the Liberal vote share in 1931 was due mainly to a lack of candidates rather than big drops in constituencies they contested in both 1929 and 1931. We have not so far looked at the 1918 election. Apart from those exceptions, there are graphs in this blog for all the relevant cases of big party losses in Britain since 1906.
All the graphs below are similar in structure to the one above. In every case, the coloured smoother showing the average relationship cannot be consistently above or below the uniform change or the proportional change line. The smoother could follow either line. But if the pattern is not so simple, better than average performance (relative to either uniform or proportional change) in one set of seats must be compensated for by worse than average performance in others.
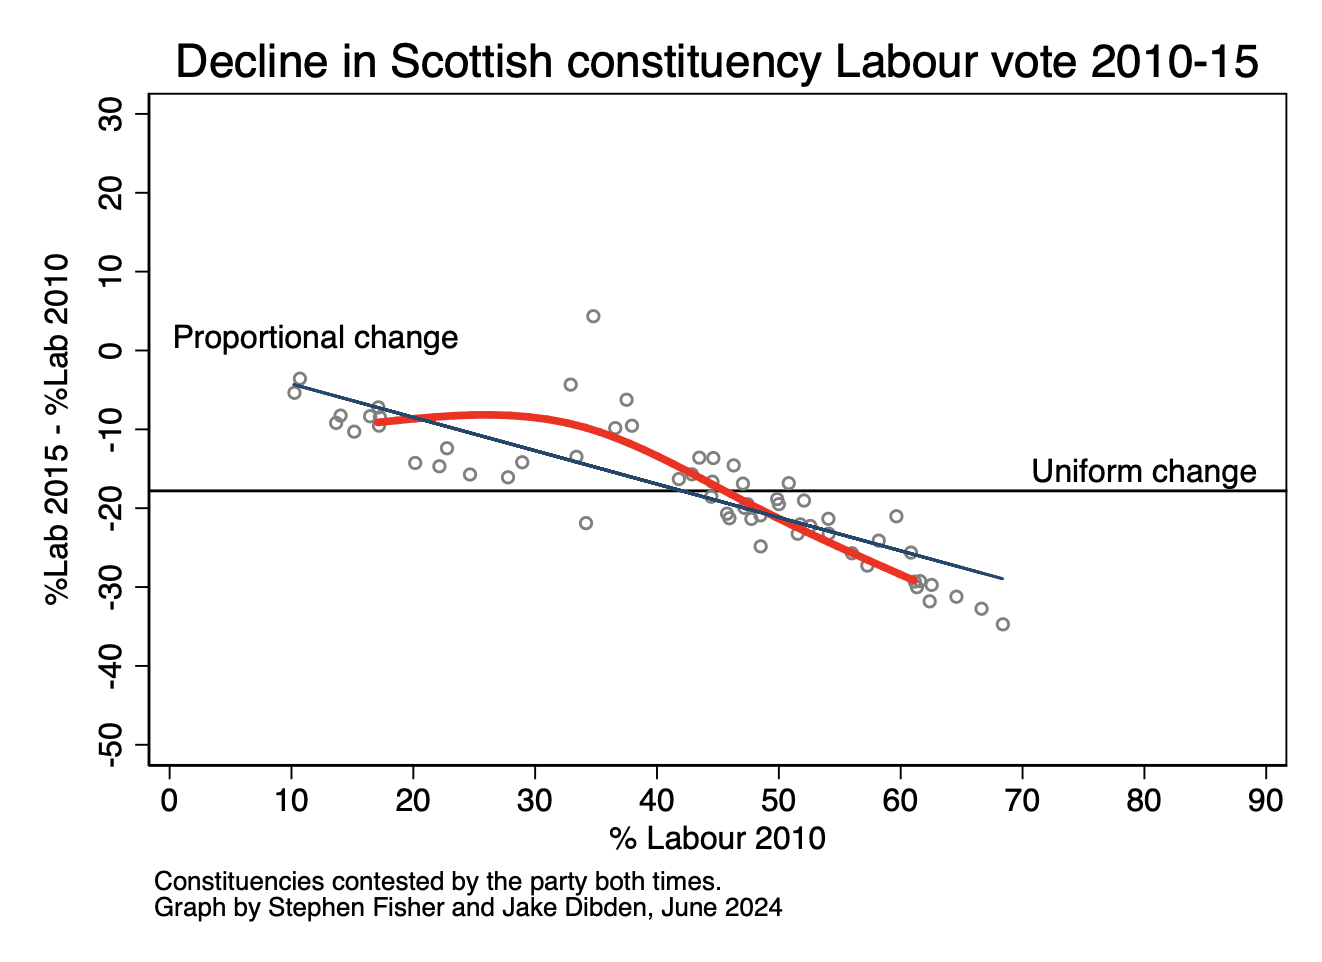
Scottish Labour 2015
After the 2014 independence referendum, the SNP vote rose and the Labour vote dropped by 18 points on average in Scotland. The graph below shows the pattern of change was broadly proportional to prior strength. That year Labour only retained one seat, Edinburgh South, which was the only one where their vote actually went up, largely as a result of tactical voting and the personal popularity of the MP Ian Murray. He won in 2015 despite winning less than 35% of the vote in 2010: below average for Labour in Scotland that year. The party lost all of the seats that were notionally safer, thanks to the pattern of proportional change in the graph below.
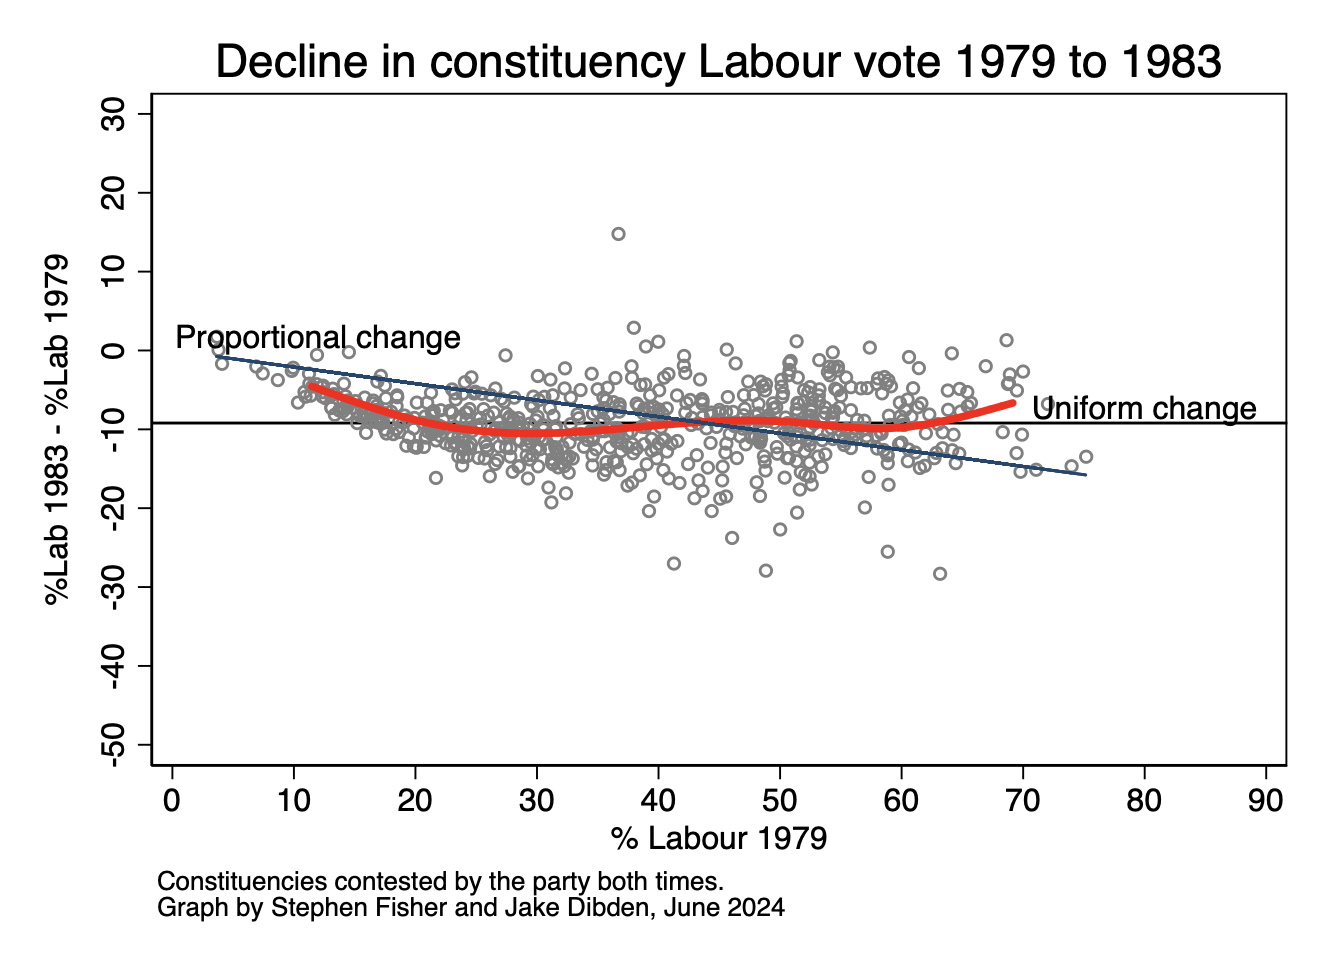
Labour in 1983
The average drop of 9 points in the Labour vote in 1983 was fairly uniform, and only very weakly correlated with the 1979 Labour share.
Conservatives in 1945
The Conservative vote dropped by an average of 15 points in the seats the party fought in both 1935 and 1945. The graph below shows that the drop in the Conservative vote was highly variable but on average somewhat proportional. That pattern of change contributed to the Conservative seat tally dropping from 419 to 202 in Britain.

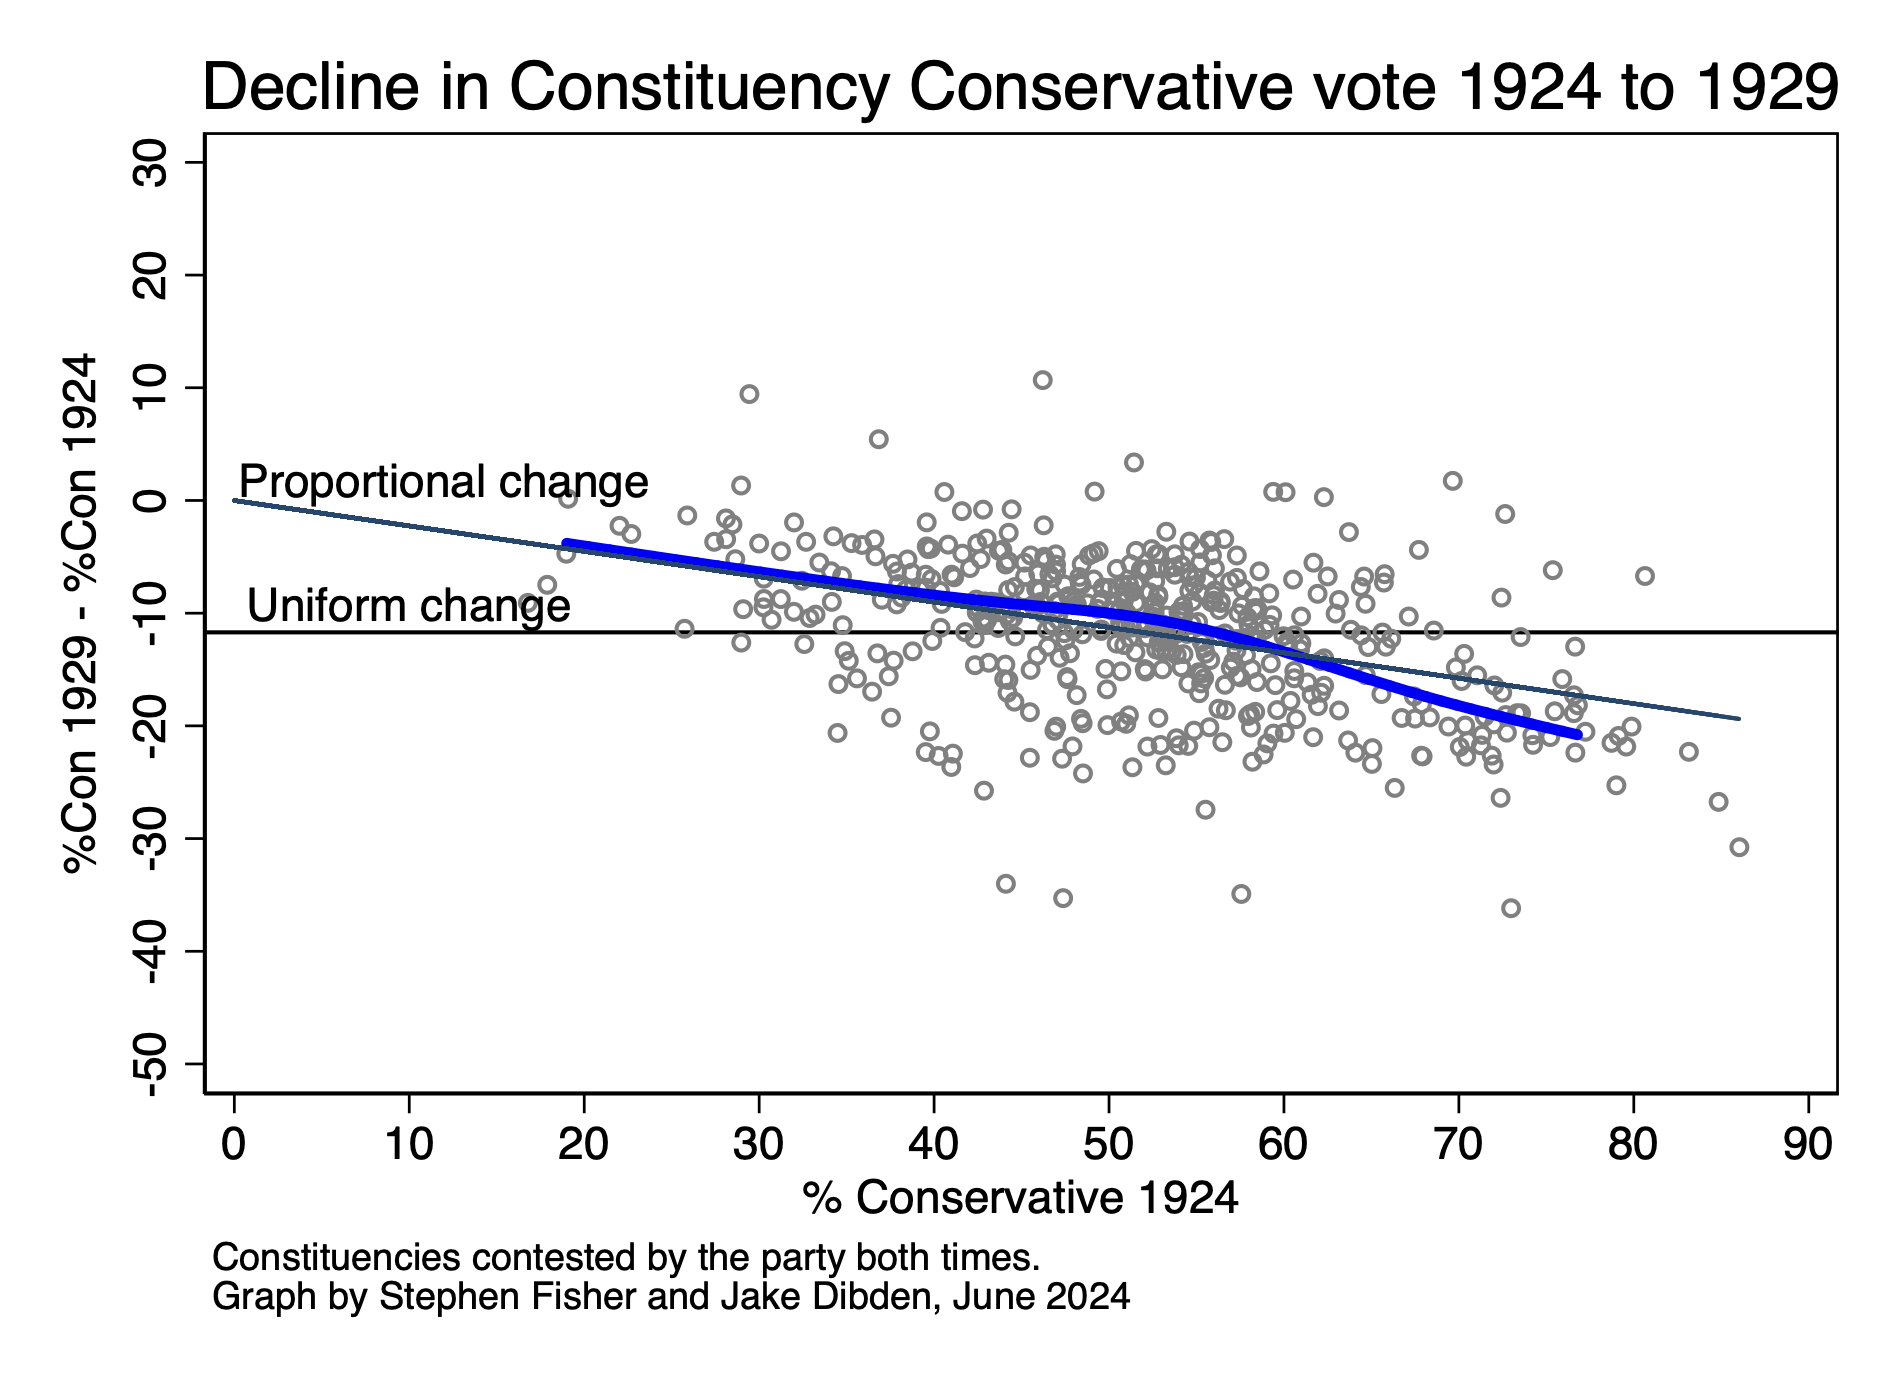
Conservatives in 1929
The 1926 General Strike marked a downturn in Conservative fortunes from which they failed to recover before the 1929 general election that brought Labour to power for the first time as the largest party in parliament. The graph below shows that the change in the Conservative vote from 1924 to 1929 was broadly proportional to their prior strength. In their very safest seats the drop in the Tory vote was even bigger than the average proportional drop.
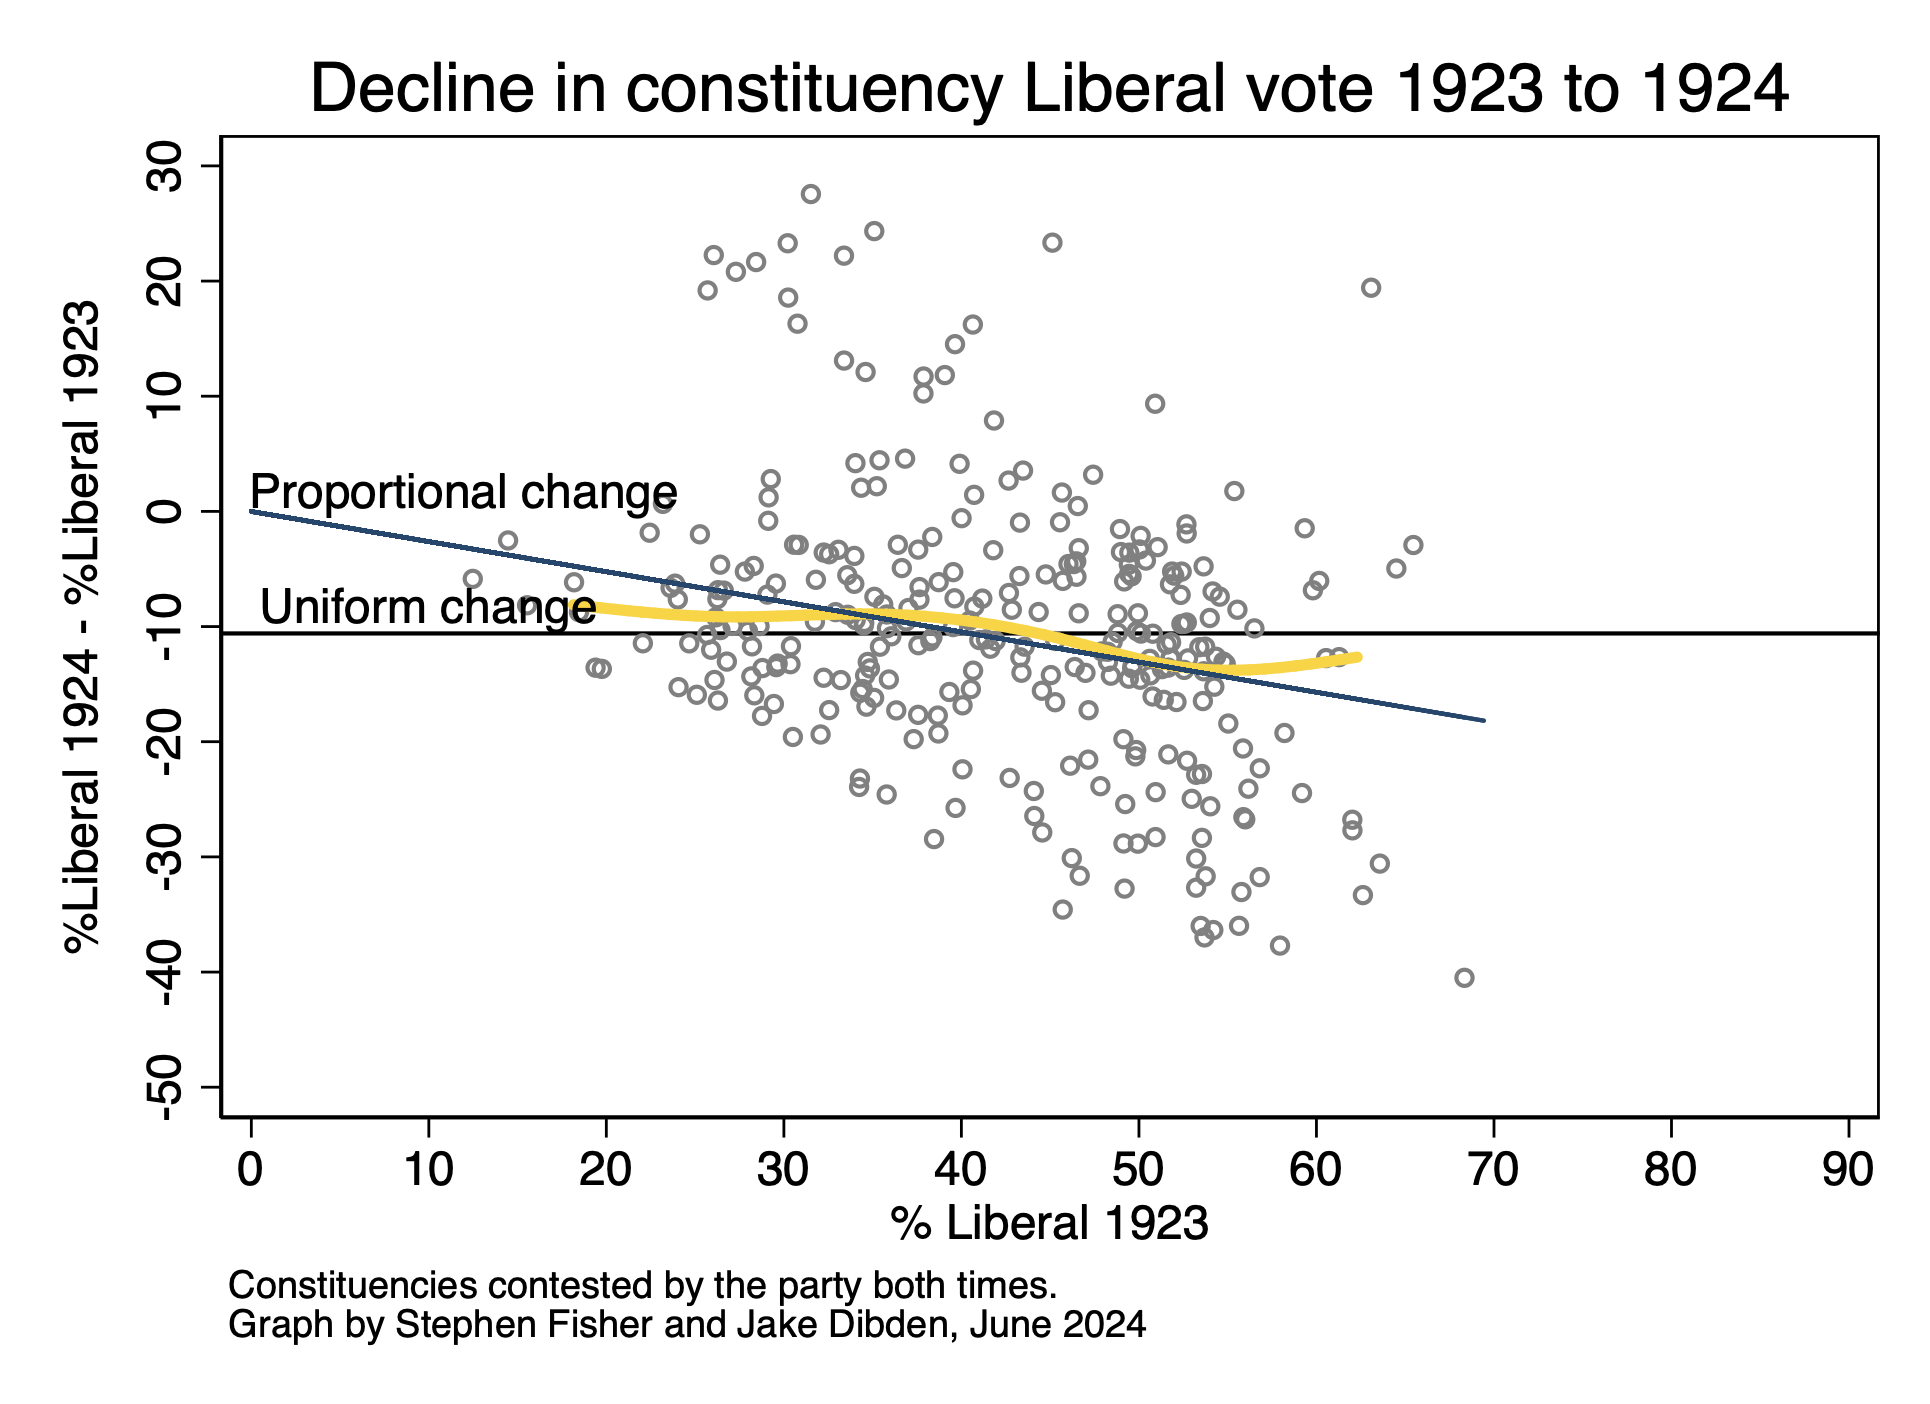
Liberals in 1924
The most striking thing about the graph below is the shear variance in the changes in the Liberal vote share in 1924, just a year after the previous election. The substantial rises are nearly all due to there being no Conservative candidate in 1924 even though there had been one in 1923. With so much variation, neither uniform nor proportional change models are a good summary.
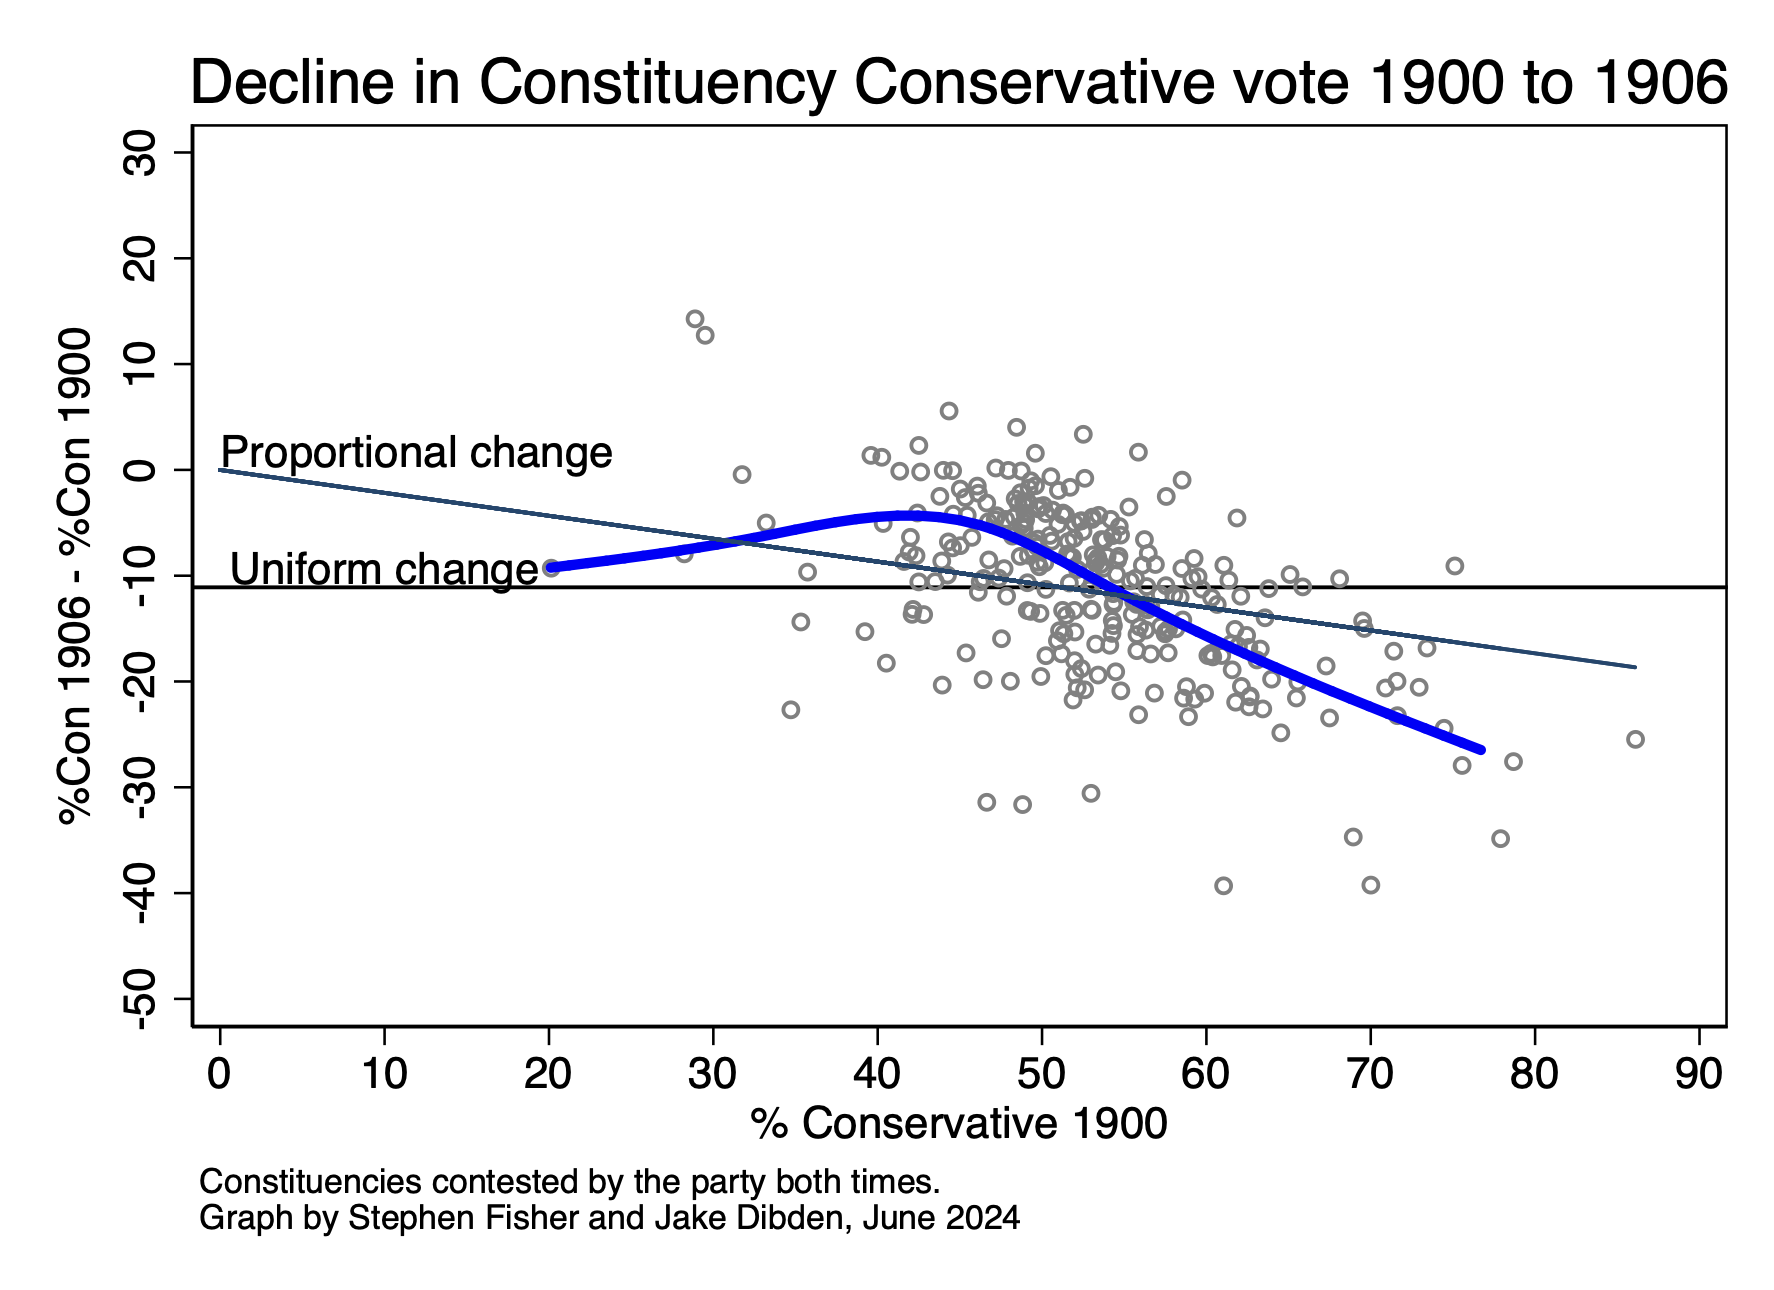
Conservatives in 1906
Narrowly worse for the Conservatives than the 1997 nadir was the Liberal Landslide of 1906, at which the Conservatives won just 141 seats in Britain. That was the Conservatives’ lowest ever number of seats, going back to 1832. That is a benchmark that the MRP models suggest the Conservatives might miss next week.
Due to boundary changes and selective candidature there are relatively few seats that the Conservatives contested in both 1900 and 1906. The changes in the Conservative share in those seats, shown in the graph below, are highly variable, but not so much as for the Liberals in 1924. For the most part, and importantly in the most Conservative seats, the drop in the Conservative vote was even larger than would have been expected if they had lost the same proportion of their 1900 vote everywhere.
Canada 1993
A more recent case of Conservatives doing extremely badly under first-past-the-post is the experience of the Progressive Conservatives at the 1993 Canadian general election. The party went from majority government with 169 seats in 1988 to winning just 2 seats in 1993. The graph below shows the decline in the party’s vote between the two elections was, in their strongest seats, even worse than might have been expected from proportional change.
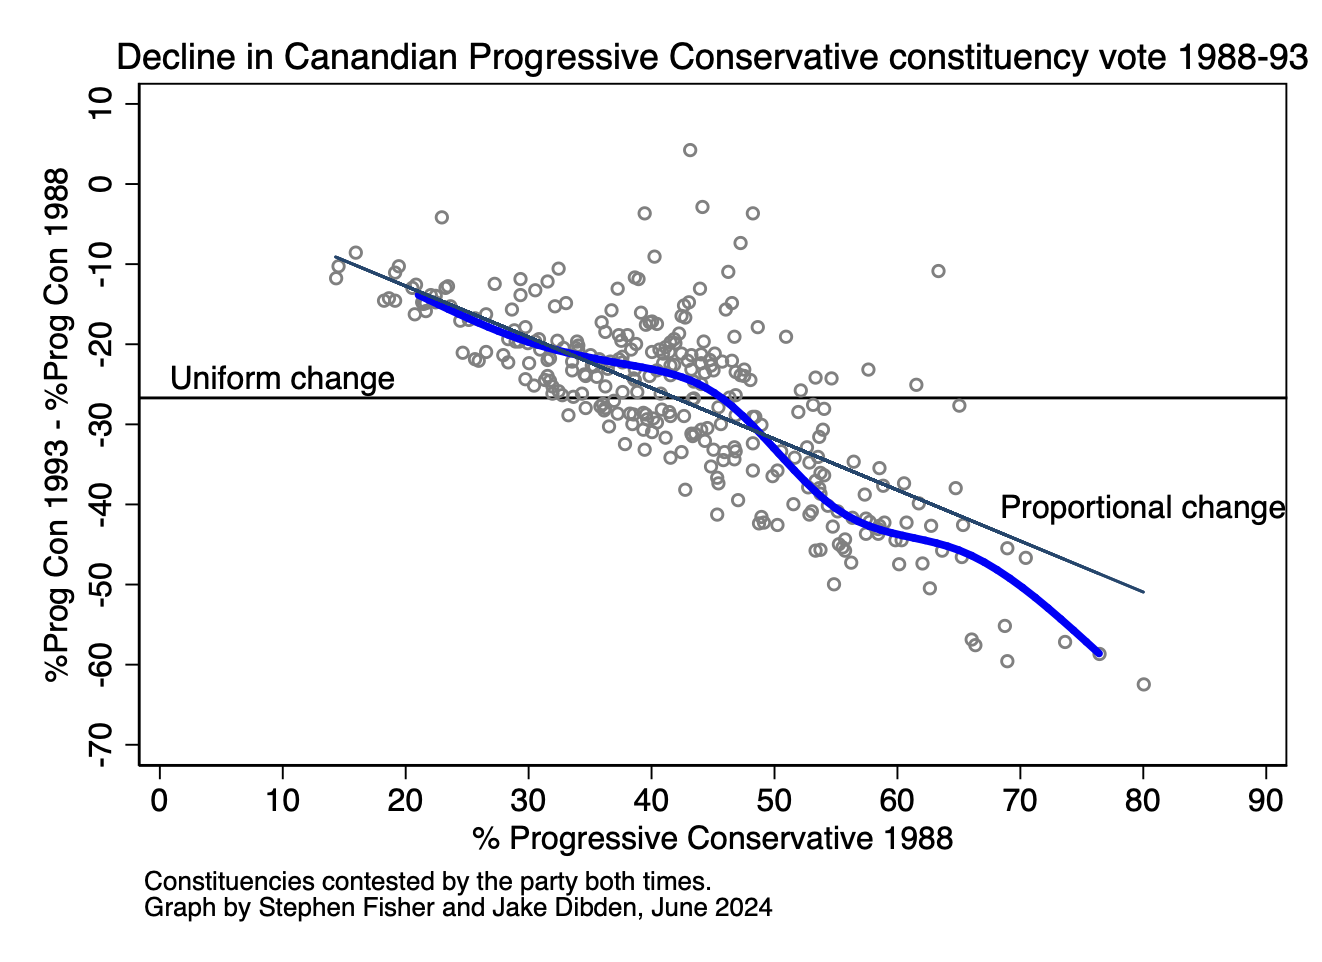
The Progressive Conservative vote dropped by 27 points from 43% to 16%. Rather similarly, the opinion polls in Britain currently suggest that the Conservatives will drop by 24 points from 45% to 21%. But that does not necessarily mean a Canadian Conservative or Scottish Labour style wipeout because of the way votes are distributed for other parties geographically.
Liberal Democrats 2015
Much more recent and perhaps a strangely comforting possibility for the Conservatives, is the experience of the Liberal Democrats in 2015. Strange because the party went from 23.6% to 8.1% of the GB vote; a loss of 65.7% of their 2010 vote.
The graph below shows that the decline in the Lib Dem vote was, for the most part, worse than average proportional change in their weakest seats, but much better in their strongest seats they were defending. In the appendix to the Nuffield Election Study, Curtice, Fisher and Ford (2015) showed that this was in large part due to higher than usual incumbency bonuses for Lib Dem MPs defending their seats. They wrote, “On average, [for Liberal Democrat MPs] support fell by 14.9 points, well below the 24.6 point drop suffered by the party where the Liberal Democrat MP was not attempting to defend his or her seat (and thus where that MP’s personal vote was at risk of being lost), or indeed the 21.8 point drop that occurred on average in those seats that the party did not win in 2010, but where it won more than 28% of the vote. The 14.9 point drop also proves on average to be 10.8 points less than the 25.7 point drop that would have been expected if the relationship between the level of Liberal Democrat support in 2010 and the fall in Liberal Democrat support had been in line with the relationship between those two phenomena in those seats that the party did not win in 2010.”
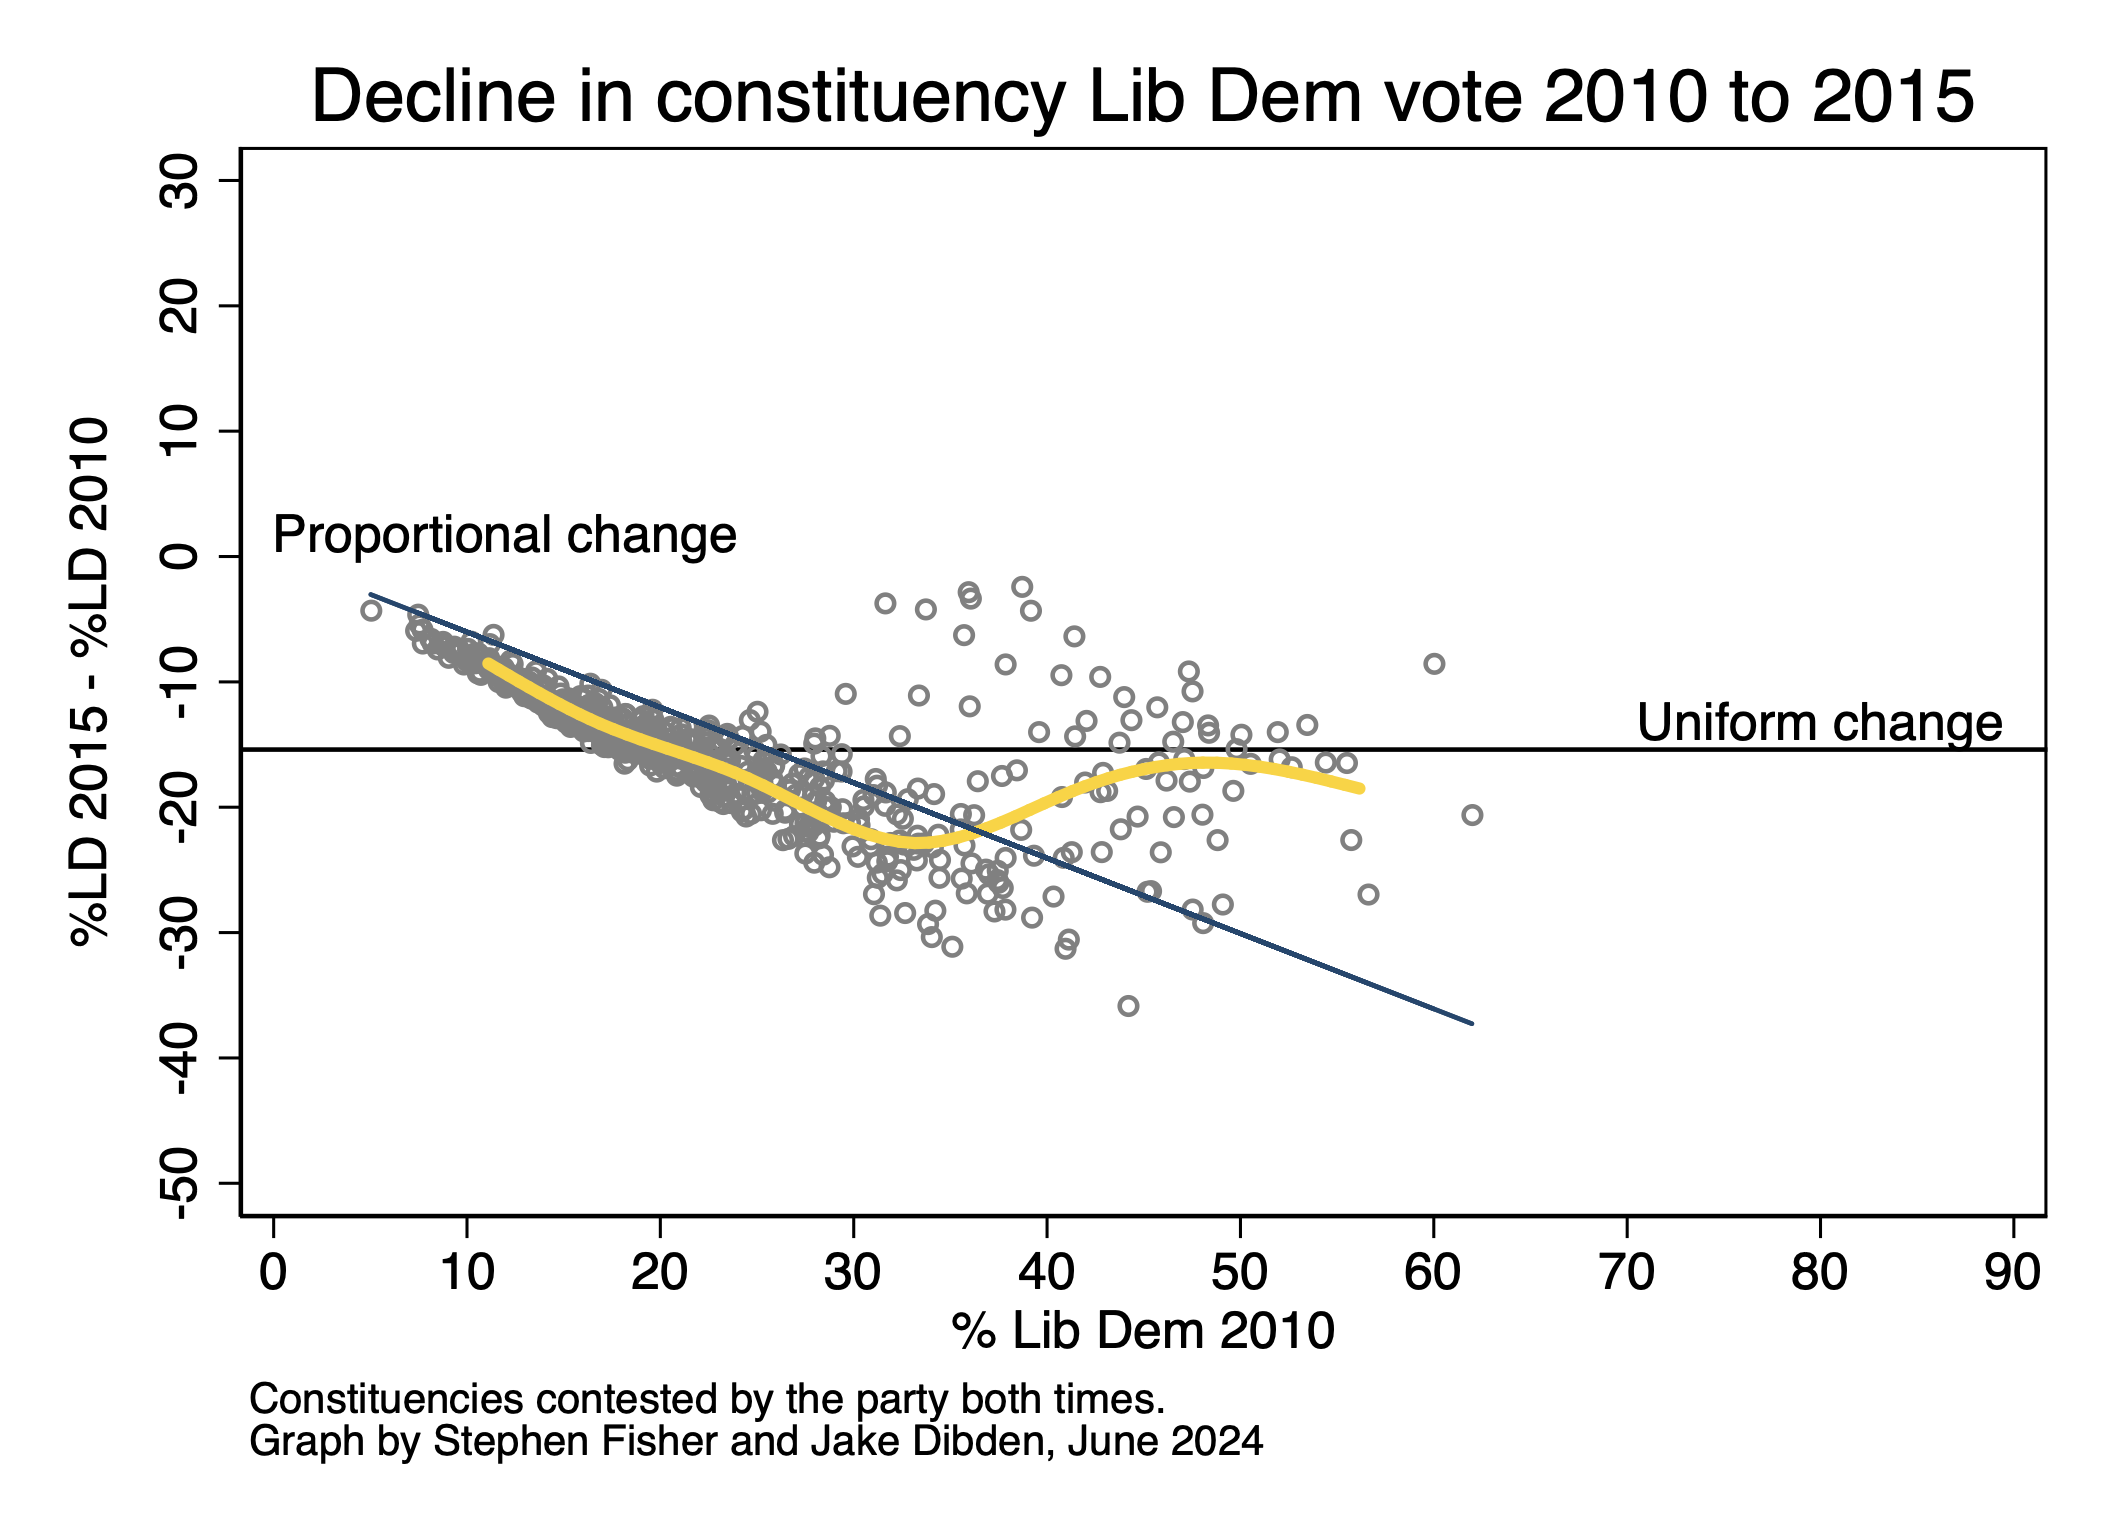
That average incumbency bonus of 10.8 points for Liberal Democrat MPs in 2015 ensured that the party won the same number of seats as they would have done under uniform change. This can be seen in the graph by the yellow line returning to be very close to the uniform change line. Proportional change across all seats would have left the Lib Dems without any seats.
The Conservatives must be hoping that their MPs will inspire similar levels of voter loyalty as Lib Dem MPs manage to inspire in 2015.
Conclusion
If the polls are roughly right, and the Conservatives really are about to lose over half the vote share they secured in 2019, then mathematical constraints mean that the party must lose more heavily in places where it is defending more than 24% of the vote.
The various historical precedents above suggests that Conservative losses could well be proportional to prior strength. Based on recent polls, that means losing 53% of their 2019 vote in every constituency. That would render the swingometer next to useless on election night.
Given the experience of by-elections in the last three years and the 2023 and 2024 local elections, proportional change would not be surprising.
The experiences of 1906 and 1929, and Canada 1993, show that the drop in the Conservative “safe” seats could be even worse than a proportional change model would predict. The MRP models could actually be underestimating Conservative losses.
However, in different ways, the experiences of Labour in 1983, the Conservatives in 1997, and Liberal Democrats in 2015 provide the Tories some hope that the worst of the seat predictions for them next week are misplaced.
It is also possible that the polls are wrong on the headline shares of the vote, as they were in 1970, 1992 and 2015, and that the Conservatives will do much better and Labour much worse than polls currently suggest. Even such big polling errors coupled with uniform change would not be enough for the Tories to stay in power. The possibility of such a scenario does mean that Labour’s majority is not in the bag yet.
