Combined forecast for GE2017: second update

By Stephen Fisher, John Kenny and Rosalind Shorrocks.

This is our first post since the Manchester bombing. We would like to take this opportunity to extend our sympathy to all those affected, directly and indirectly. Now that the political parties are campaigning again we hope that it is not insensitive of us to update our forecasts.

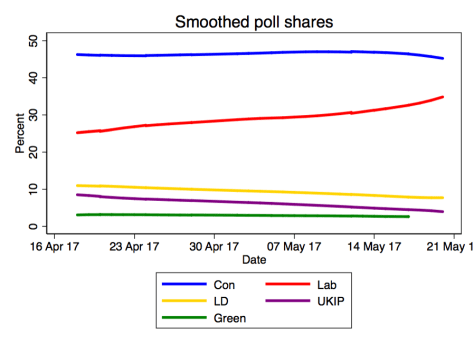
In truth, because of Monday’s terrible events it is not clear how our forecast should be interpreted. Only one poll conducted since the attacks has been published, so most of the changes in the opinion poll data, and the models that are built on them, reflect polls conducted late last week; shortly after the Conservative manifesto launch and mostly before Theresa May’s announcement of a cap on social care funding. Those polls showed a considerable tightening of the Conservative lead and so a reduction in the predicted Tory majority.

Overall, our combined forecast of the Conservative majority has dropped to 100, down from 123 last week and from 132 two weeks ago.

Seats Betting Markets Complex models Simple model Volunteered Average
Con 380 382 356 381 375
Lab 181 189 210 173 188
LD 15 8 6 10
UKIP 0 0 0 0
Green 1 1 1 1
SNP 46 48 55 50
PC 3 3 3
Con majority 110 114 62 112 100

The combined probability of a Conservative majority, at 87% has correspondingly taken a small dip from 91% last week. More strikingly the probability of a Conservative landslide (a 100+ seat majority) has fallen from 64% (and 71% two weeks ago) to just 34% this week. The citizen forecast component of this average has not changed due to lack of new data. Previously that component was pulling down the average. Now it is pushing up. The markets and our pseudo-probability from the polls are both around 30%. Intriguing there is some inconsistency between the PredictIt market suggesting a 27% probability of a 100+ majority and the spread-betting markets pointing to a 110 seat majority.

Betting markets Models Polls Citizen forecast Average
Con majority 0.87 0.87 0.94 0.79 0.87
Con landslide 0.27 0.31 0.43 0.34

Continue reading Combined forecast for GE2017: second update

What’s been happening in the polls?

by Stephen Fisher.

Since the general election was called Labour have gone up in the GB vote intention polls while the Liberal Democrats and especially UKIP have dropped. The Conservatives have fluctuated but on average remained steady. The following graph shows the overall trends.GE17campaigntrendgraphv1

Looking at those pollsters that have published at least two polls since 18th April, the picture is pretty consistent for Labour, the Liberal Democrats and UKIP. As following three graphs of GB polls by fieldwork end date show, the trends are pretty much the same for nearly all pollsters.

labhouseplot

ldhouseplotukiphouseplot

The more complicated picture is for the Conservatives. They went up on average at the beginning of the campaign, but, as the graph below shows, this was true for some but not all pollsters. Since the start of May there seem to have been somewhat trendless fluctuations for all the pollsters with no consistent trends. There is only a small suggestion that the Tories peaked at the end of last week only to come back down slightly this week.conhouseplot

The net effect of the Conservative and Labour changes is a decline in the Tory lead for most but not all pollsters, as shown in the following graph. Viewed this way, the smaller than usual leads in tonight’s polls do not so much constitute a “wobble” as a continuation of a trend.

leadhouseplot

The average lead across the most recent poll from each pollster within the last two weeks is now 15 points. This is just short of the 16 point lead that is probably needed for a 100+ Conservative majority. Also, Labour are now polling on average slightly above their 2015 GB vote share.

These observations might be thought to provide some concern to Mrs May and comfort to Mr Corbyn. But the average of the final polls in 2015 had Labour a couple of points higher than Labour are now, and the eventual Conservative lead in 2015 was 7 points bigger than it was in the final polls.

A similar discrepancy between the polls and the actual result is not guaranteed to happen again, but it might.

Combined forecast for GE2017: first update

By Stephen Fisher, John Kenny and Rosalind Shorrocks.

Since our first forecast combining different indicators of the election outcome last week, the Conservatives and particularly Labour have edged up in the polls at the expense of UKIP and the Liberal Democrats. The crucial Conservative-Labour lead in the polls this week has varied from between 13 to 20 points. On average the lead has narrowed by just under two points to 16.5.

In line with this movement in the polls, the predicted Conservative majority from the betting markets and the simple models has dropped, but not, intriguingly, in the complex model forecasts. On average, our combined forecast is for a Tory majority of 123; down a little from 132 last week but still a big win.

Seats Betting

Markets

Complex

models

Simple

models

Volunteered Average
Con 395 391 378 381 386
Lab 167 178 191 173 177
LD 15 10 13 13
UKIP 0 0 0 0
Green 1 1 1 1
SNP 46 47 45 46
PC 3 3 3
Con majority 140 133 106 112 123

The combined probability of a Conservative majority, at 91%, has remained unchanged from last week. However, the probability of a Conservative landslide has taken a small dip to a 64% chance (down from 71%). This drop is almost entirely due to Labour’s better performance in more recent polls, resulting in fewer leads for the Conservatives of 16 points or more required for a 100+ majority (the basis of our pseudo-probability from the polls).

Betting

markets

Statistical

Models

Polls Citizen

forecasts

Average
Conservative Majority 0.95 0.91 1.00 0.79 0.91
Conservative landslide 0.81 0.67 0.43 0.64

Continue reading Combined forecast for GE2017: first update

UKIP dropout did not help the Conservatives much in the local elections

By Stephen Fisher.

UKIP are putting up just 377 candidates at the general election, well short of the 624 they had in 2015. Given that the polls are showing that around half of former UKIP voters are planning on voting Conservative this year, and given that the Conservatives clearly benefitted from the collapse of the UKIP vote in the local elections, surely UKIP dropout is a big advantage for Theresa May?

Perhaps not. A good way of assessing this question is to look at the experience of local elections and analyse how much other parties benefitted when UKIP stood a candidate in 2013 but not this year, compared with where they had candidates both times. To make the context more like a general election I focus just on places fought by the Conservatives, Labour and the Liberal Democrats both in 2013 and 2017.

There were 969 such divisions where the BBC collected the full details of the result. Of these 523 had UKIP candidates both times, and 446 had a UKIP candidate last time but not this time – only a slightly higher (46%) dropout rate than that for the general election (40%).

Continue reading UKIP dropout did not help the Conservatives much in the local elections

First Combined Forecast for the 2017 general election

By Stephen Fisher, John Kenny and Rosalind Shorrocks.

The betting markets, polls, statistical forecasting models and volunteer forecasters are all pointing towards a landslide majority of around 132 for the Conservatives in the UK general election on 8th June. Surveys of citizen expectations are more limited and less clear, but by our analysis they suggest that 43% of people in society at large are expecting a Tory majority of over 100.

Historically the idea of combining forecasts from different sources has had a good track record, though it has to be admitted that our attempt to do one for the EU referendum did not work out well. Most recently the pollyvote.com combined forecast of the US presidential election last year was 2 points out on the share of the vote.

This is the first of our Combined Forecasts for next month’s general election in which we aggregate seats and vote share forecasts from a variety of sources including betting markets, polls, statistical forecasting models, volunteer forecast aggregators, and citizen forecasts. We will update weekly and the methodology (as detailed below) will evolve.

All the different sources point to a big Conservative win and there is little sign of doubt that the Conservatives will get at least a majority. Various different complex forecasting models are pointing to majorities for Theresa May of between 110 and 174, with an average of 130. Betting and prediction markets are just a little more bullish with an average majority of 146.  Volunteers contributing forecasts to the Times Red Box sweepstake are only slightly more cautious. Details of the average estimate from each source, and the overall average number of seats expected for each party are in the table below.  In addition to the big Conservative majority they collectively suggest that the Liberal Democrats seat tally will only increase by four and that the SNP will be down seven.

Seats Betting Markets Complex models Simple models Volunteered Average
Con 398 390 394 380 391
Lab 158 178 173 172 170
LD 18 11 9 13
UKIP 0 0 0 0
Green 2 1 1 1
SNP 45 49 51 49
PC 3 3 3
Con majority 146 130 138 110 132

Not only are the headline forecasts from these sources remarkably strong for the Conservatives but the evidence from the polls and the models is consistent. There is also little sign of doubt among punters. The table below shows the implied probabilities of there being a Conservative majority and a Conservative landslide (100+ majority) from the betting markets, forecasting models (where available) and the polls (as judged by the proportions of polls showing the required lead). The citizen forecasts in the table show the proportion of respondents (excluding Don’t Knows) expecting each outcome. They are noticeably much more cautious and both ICM and YouGov surveys have shown as few as 30 per cent expecting a Conservative landslide.

Probabilities Betting markets Statistical Models Polls Citizen forecasts Average
Conservative Majority 0.96 0.92 1.00 0.77 0.91
Conservative landslide 0.83 0.86 0.43 0.71

The sources for vote-share forecasts are more limited but again remarkably consistent across polls, markets and forecasting models. The polling average is an average of seven different polling averages. They are at best nowcasts rather than forecasts. The statistical models give actual forecasts. Even though the polls have underestimated the Conservatives and overestimated in the large majority of general elections, and substantially so in 2015, all but three of the four forecasting models with vote shares are expecting Labour to outperform the polls and the Tories to underperform. The betting markets are expecting the opposite; an even bigger Conservative lead than the polls are showing.

% vote Polling average Betting markets Forecast Models Average
Con 46.8 47.4 45.0 46.4
Lab 28.7 26.9 27.6 27.7
Lib Dem 9.6 12.2 10.9
UKIP 6.4 3.9 6.3 5.5
Green 2.8 2.6 2.7
SNP 4.3 4.1 4.2
PC 0.6 0.6 0.6

Methodology

Continue reading First Combined Forecast for the 2017 general election

Welsh Local Election Forecasts 2017

by Stephen Fisher.

Update 18.40, 4.5.17: I was mistaken as to the method for the Rallings and Thrasher projection, the details have now been corrected. Nothing about my forecast has changed. 

This is definitely just for curiosity value only! Last week Roger Scully released the results of his Welsh Political Barometer survey which included Westminster and local election vote intention questions see here. The changes on the comparable survey from just before the last main round of Welsh local elections five years ago are presented in the first and third columns of the table below. Colin Rallings and Michael Thrasher did a seat projection based on the change from the actual 2012/3 local election vote share to the 2017 local-vote intention poll (Con +13, Lab -8, LD -1, PC +3), as discussed by Roger Scully here and listed in the second column of the table.

%Local vote Rallings & Thrasher %GE vote Regression
12-17 change seat change 12-17 change seat change
CON +9 +90 +17 +272
LAB -20 -130 -20 -320
LD 0 0 +1 +12
PC +2 +20 +1 +16

The final column of the table represents my attempt to translate the changes in the Westminster vote intention into changes in local election seats, similarly to the way I did for the English local elections. Regression analysis of local election results in Wales since 1995 shows strong linear relationships between votes and seats for each of the main parties, with the partial exception of the Liberal Democrats. On average the main parties have picked up around 16 extra seats for every percentage point extra in the overall share of the vote (just 12 for the Lib Dems).

If this relationship were to continue and if the changes in the opinion polls since 2012 were to be reflected in the results then the numbers of gains and losses would be much bigger than suggested in the Rallings and Thrasher projection. For instance Labour would be expected to lose 320 not just 130 seats.

By implication the geography of local election voting must be doing a lot of work to dampen the scale of gains and losses for the Conservatives and Labour parties in the Rallings and Thrasher projection. It would seem that there are a lot very safe Labour council seats in Wales and the system is extremely biased to Labour. The Rallings and Thrasher projection implies that the Labour would win with a 2 point lead over the Conservatives in votes, but more than twice as many seats (450 to 195). That would be extraordinarily unjust.

Projecting the changes in the Westminster vote intention on to seats with the regression method (final two columns) suggests the Conservatives will emerge (for the first time in a long time) with a substantial lead in both votes and seats.

Thanks to Eilidh Macfarlane for help with the data.

Scottish Local Elections Forecast 2017

by Stephen Fisher

The local elections in Scotland tomorrow will be conducted using the Single Transferable Vote (STV) system, a form of proportional representation. As the graph below shows, the relationship between seats and votes has been close to but not perfectly proportional in the only previous sets of STV elections. Larger parties tend to be a little over-represented, smaller parties a little under.

ScotLocalsSeatsVotes

However, the Conservatives were noticeably less well represented than might be expected from their size alone. For my seats forecasting model (a regression of seat share against first preference vote share, with zero intercept) I have interpreted these as party effects that are likely to be replicated again this week, but we shall see.

Continue reading Scottish Local Elections Forecast 2017

Forecasting English Local Election Seat Gains/Losses 2017

by Stephen Fisher

I am planning on forecasting the general election, but first things first. There are local elections this week.

My seat gains/losses forecasts for the English council elections this year are definitely more for curiosity value than to be taken very seriously. They are based on a simple model which uses change in party support in the polls since the equivalent round of elections four years ago to predict seat changes at the national level. The Conservatives are at 46% in the polls; up a massive 15 points on 2013. Labour are down 11 points in the polls since last time; extraordinary for an opposition party. With such big changes in the polls my model inevitably predicts very big net seat tally changes for these parties. But it does not take the electoral geography into account. Many of Labour’s seats are likely to be very safe and the Conservatives might find it hard to recoup many more than the 337 they lost last time.

With that caveat and with more below, my forecasts, together with those from Colin Rallings and Michael Thrasher, are presented in the table below. They also forecast UKIP -105. My modelling approach still cannot manage a sensible UKIP forecast.

 2017 Forecast Range Rallings & Thrasher
Con +430 +190 to +670 +115
Lab -315 -555 to -75 -75
LD -30 -265 to +210 +85

Continue reading Forecasting English Local Election Seat Gains/Losses 2017