Local elections Projected National Share (PNS) of the vote 2022

By Stephen Fisher, 6th May 2022.

The BBC Projected National Share (PNS) of the local election vote 2022 is Con 30, Lab 35, LD 19, Others 16.

There is an explainer of the methodology at https://electionsetc.com/2022/05/04/understanding-the-local-elections-projected-national-share-pns-in-2022/.

Historically, party performance in local elections has followed a similar pattern of change over time to the general-election vote-intention opinion polls, as shown the graph below.

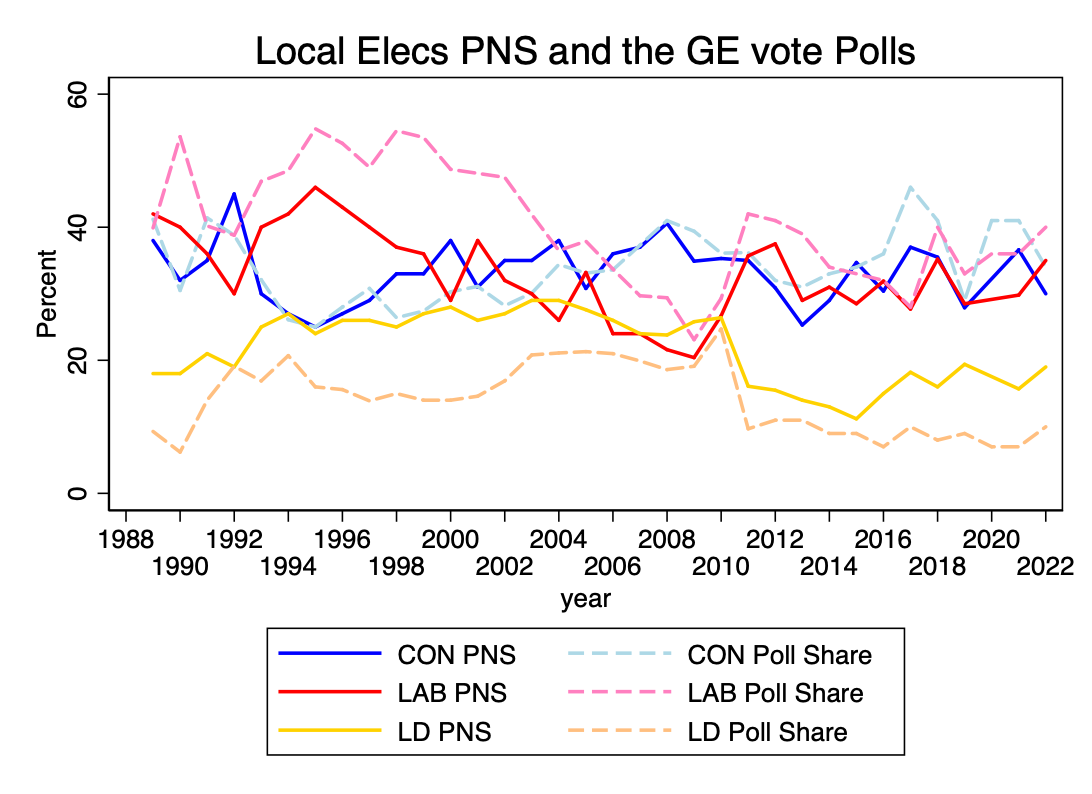
Changes in the PNS this year are broadly in line with changes in the polls relative to both 2018 and 2021. The Conservatives are down 7 in the polls since both 2018 and 2021, and down 5 and 6 points respectively in the PNS. Labour are at the same level in the polls and PNS as they were in 2018, but up 4 points in the polls and 6 points in the PNS since 2021. 

In both the polls and the PNS the two parties were tied in 2018. After Boris Johnson became PM the Conservatives achieved a lead that won them the 2019 general election and lasted through to 2021. Following partygate and various other controversies, that lead has been reversed. This week’s local elections essentially confirmed the message from the polls that Labour are now ahead.

In recent years the Liberal Democrats have revived their tendency to do much better in local elections than they do in general election vote intention polls. That pattern was established in the 1980s with the Liberal Alliance, but ended after the Lib Dems joined the coalition in 2010. This year the party continued its post-coalition revival. They are up 2 or 3 points relative to both 2018 and 2021, in both the PNS and the polls.

Its not such a consistent pattern with respect to other baselines.

Indications from the local elections for the next general election?

The Projected House of Commons’ seats from the PNS (with changes from the 2019 general election) is

Con 253 (-112)

Lab 291 (+88)

LD 31 (+20)

Others 75 (+4)

The Projected House of Commons takes into account differences in local and general election voting on recent occasions when the two kinds of election have been on the same day.

Continue reading Local elections Projected National Share (PNS) of the vote 2022

Understanding the Local Elections Projected National Share (PNS) in 2022

by John Curtice and Stephen Fisher, 4th May 2022.

Much of the speculation about what might happen in the English local elections tomorrow has focused on how many seats each party could or should gain or lose. Indeed, we can expect many a judgement to be cast on Friday on the basis of this evidence. However, given that these elections are held under first past the post (and in London multi-member plurality), seats won and lost can be a poor guide to how well a party has done in the ballot box. A party whose vote has fallen less than that of their principal rivals may gain seats even though it has lost votes. A third party whose vote is geographically spread may make a substantial advance in votes yet reap little reward in terms of seats. Meanwhile, even if these issues do not arise, seats won and lost only provide an indication of whether a party has lost or gained ground as compared with when the seats up for grabs were last contested – which this year, as is usually the case, was four years ago.

Yet we cannot simply add up votes cast either (even if we had the resource to collect them all on election night). In England (unlike Scotland and Wales) it is never the case that the whole country votes in local elections at the same time. The places that vote one year are politically different from those that vote in another. Given all these limitations, a key indicator of party performance that has come to be part of the ritual of local election night is the calculation of a ‘projected national share’ (PNS). This is an estimate of the share of the vote that the principal parties would have won in a GB-wide general election if voters across the country as a whole had behaved in the same way as those who actually voted in the local elections that year in England. It provides a single, seemingly straightforward measure of party performance that can tell us not only how well or badly a party has done as compared with four years ago, but also as compared with any previous local elections for which a PNS is available – even though the places in which local elections are held varies considerably from one year to the next.

Yet almost inevitably answering such a ‘what if’ question is not as straightforward as it might seem. Given the large number of wards being contested, the calculation of the PNS has to be made on the basis of a sub-sample of the local contests. None of the parties fight all of the wards being contested, and some may well fight fewer wards than others. At the same time, local election results in England tell us nothing about the performance of the nationalist parties in Scotland and in Wales. Any estimate of the PNS is affected by the decisions that are made about how best to address these issues. It is thus not surprising that there have often been some differences between the PNS that we have calculated for the BBC at previous local elections and that calculated by the local election experts, Colin Rallings and Michael Thrasher of Plymouth University, whose National Equivalent Vote (NEV) appears each year in The Sunday Times. 

Those differences are typically limited with neither the PNS or NEV consistently better for any party. But since 2015 there has been a tendency for the PNS to be higher for Liberal Democrats and Others, and correspondingly lower for the Conservative and Labour than the NEV series. This can be seen in the table below. 

 NEV:   PNS:   Diff:   
 ConLabLDOtherConLabLDOtherConLabLDOth
20132629143125291432-100+1
20143031112829311327 -10+2-1
20153631102335291125-1-2+1+2
20163233142130311524-2-2+1+3
20173928181537281817-200+2
20183736141335351614-2-1+2+1
20193131172128281925-3-3+2+4
20214030151536291718-4-1+2+3

It is not entirely clear why these gaps have emerged. Here we aim to explain some of the key features of the PNS methodology that might help explain the difference. In doing so, our aim is not to suggest that one approach is better than another, but rather to explain some of the decisions we have made that can have an impact on the figures we publish. 

Continue reading Understanding the Local Elections Projected National Share (PNS) in 2022

Forecasting Local Election net seat gains/losses 2022

by Stephen Fisher, 3rd May 2022.

There are local elections tomorrow in England, Scotland, and Wales. Table 1 below shows my forecasts for net seat changes for each. They are based on projecting changes in opinion poll performance since the last round of local elections, with different methods for the different countries as discussed below. They represent what we might expect if the changes in party performance in local elections are on par with changes in the opinion polls.

Table 1. Forecasts for English local election net seat gains/losses for 2022

EnglandWalesScotlandOverall
Con-165-80-36-281
Lab+140+80+84+304
LD+700+6+76
PC 0 0
SNP  -24-24

The Conservatives are expected to lose seats in all three countries. They are defending a strong 2017 base in Scotland and Wales, and dropped in the polls since both 2017 and 2018 when the English seats were last fought. 

Labour are expected to be the main beneficiaries from Conservative losses. The projections suggest Labour might recover most but not all the losses they suffered in 2017 in Scotland and Wales. In England, Labour are trying this week to build on cumulative gains from 2010, 2014 and 2018. They already control over half the seats up this year. Since Labour are at 40% in the polls, their poll support is no greater than is was in 2018. Instead of gaining seats from winning more voters, Labour are projected to make council seat gains in England primarily from the drop in the Conservative vote. But, as discussed below, last-year’s experience shows there are various reasons why that might not happen. 

Perhaps most surprising of the forecasts is the projected drop in SNP seats from what was considered a disappointing performance in 2017, winning only 32% of the first-preference vote when typically the party has been winning at least 45% of the vote in Scotland-wide elections since the independence referendum in 2014. My projection for the Scottish locals this week is based on changes since 2017 in local-election first-preference vote intention polls. Even general-election vote-intention polls show no advance on 2017 for the SNP. The party will be hoping that more of the people who vote for them in Westminster and Holyrood elections will support them in the locals this week. 

England

Typically, the Conservatives lose English council seats when their lead over Labour in the opinion polls drops from what it was the last time the election was fought. Similarly, if the Tories extend their lead, then they typically make net gains. The graph below shows that pattern for local elections in England when the Conservatives were in government and the local elections were not on the same day as a general election. There is a strong correlation, but with a lot of noise around it, meaning any forecast comes with a big range of uncertainty. This year either of the two main parties could be either up or down by more than 100 seats based on the variation in previous local elections.

Last year’s local elections contributed to that noise. The graph above distinguishes between what happened in the elections that were delayed from 2020 because of the Covid pandemic, and those that happened in 2021 as scheduled. The Conservatives substantially outperformed expectations from the historical pattern for both sets of elections. They made +248 gains in the “2020” set despite polls (in 2021) showing only a 1-point increase in the Con-Lab lead since 2016. For the 2021 set, the Tories suffered a net loss of only 14 seats despite the poll lead dropping by 13 points from the high that Theresa May enjoyed in the 2017 local elections (before losing most of it at the general election the following month).

Continue reading Forecasting Local Election net seat gains/losses 2022