Fourth combined forecast for the 2019 general election

By Stephen Fisher, John Kenny and Rosalind Shorrocks 

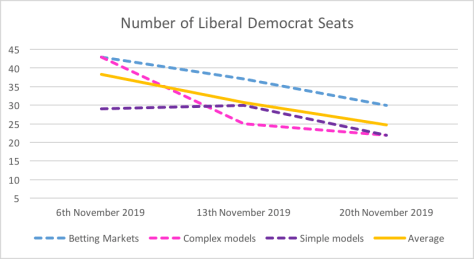
There has not been much change in our combined forecast over the last week. The Conservatives are still apparently headed towards a comfortable majority (55 on average) based on an average forecast vote share lead over Labour of 12 points. The average predicted probability of a Tory majority has crept up to 72%, partly due to increasing confidence in the betting markets and the quantitative forecasting models, as well as the polls. Citizens remain much more sceptical. Concerns that the Liberal Democrats might make little advance continue, and were compounded by the Datapraxis MrP forecast of just 14 seats for the party. Otherwise the Datapraxis forecast was largely in line with other forecasts of headline seats totals. Further MrP based forecasts are due this week, including YouGov’s.
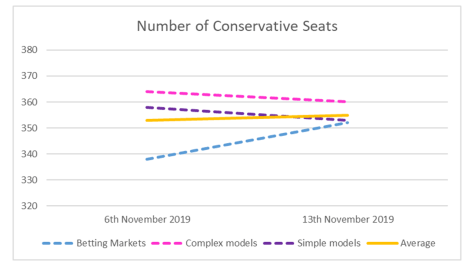
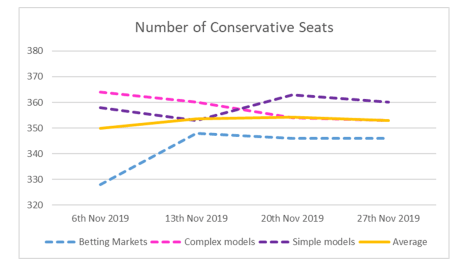
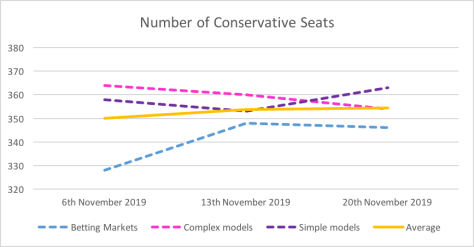
Seats Betting Markets Complex models Simple models Average
Con 346 353 360 353
Lab 210 212 204 209
LD 25 21 22 23
Brexit 0 0 0
Green 1 1 1 1
SNP 45 45 43 44
PC 4 4 4 4
Con majority 42 55 69 55

Conservative Seats - 27th November   Continue reading Fourth combined forecast for the 2019 general election

Third combined forecast for the 2019 general election

By Stephen Fisher, John Kenny and Rosalind Shorrocks 

Once again all three sources of seat forecasts suggest the Conservatives are heading to a comfortable majority, while Labour are on course for a result on par with their previous post-war low of 209 seats in 1983. The Liberal Democrat forecast has been dropping steadily, so that they are now expected to end up with only a few more MPs than the twenty they had when they chose to support the election.

Seats Betting Markets Complex models Simple models Average
Con 346 354 363 354
Lab 209 211 200 206
LD 30 22 22 25
Brexit 0 0 0
Green 2 1 1 1
SNP 46 46 44 45
PC 4 4 4 4
Con majority 42 58 75 58

Con seats 20 NovLib Dem seats 20 Nov 

Continue reading Third combined forecast for the 2019 general election

How did the election forecasts do in 2017?

By Stephen Fisher, Rosalind Shorrocks and John Kenny.

Lots of the forecasts for the 2017 British general election were wrong in pointing to a Conservative majority. Most even suggested an increased majority when the party actually lost one. The well-known exceptions are the exit poll and YouGov multilevel regression and post-stratification (MRP) model. Less commonly remembered are the polls that were within a point of the Conservative-Labour lead and so, by standard uniform change calculations, provided an indication that the Tory majority was in jeopardy.

During the election campaign we ran an exercise combining the different forecasts for shares of the vote, seat tallies, and probabilities of a Conservative majority. Inevitably the combined forecast is only as good as the average of what goes into it, and that average was poor. But since the exercise involved classifying and averaging forecasts by the methodology they used, it is possible to reflect on which types of forecasting method performed better than others.

The figure below shows predictions of the Conservative share of the vote over the course of the campaign from the Political Studies Association (PSA) expert survey, betting markets, forecasting models and opinion polls. Strictly speaking polls are snapshots not forecasts, but the final polls performed as well as the experts and better than all the other methods. Consistently the worst source of predictions for the Tory share were the betting markets.

Conservative Vote Share 2017
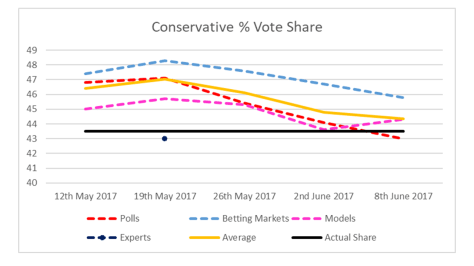
Note: Due to an error in our 2ndJune 2017 betting market calculation (and no way of correcting it at this stage) the betting market line runs direct (interpolates) from 26thMay to the final 8thJune 2017 estimate.

Continue reading How did the election forecasts do in 2017?

Second combined forecast for the 2019 general election

By Stephen Fisher, John Kenny and Rosalind Shorrocks

There are still just a few different forecasts for the general election. Perhaps the big changes during the 2017 campaign have made people more hesitant about predicting early this time. Perhaps the problems of the polls in 2015, 2016 and 2017 have put some off the idea entirely. (More on this in our post-mortem for the 2017 combined forecast which we’re still working on.) Nonetheless, this is the second of our weekly blogs where we review the different forecasts from different methods and combine them into an overall forecast.

Here we aggregate seats and vote share forecasts from a variety of sources including betting markets, polls, statistical forecasting models and citizen forecasts. As well as updating weekly, the methodology (as detailed below) might well evolve. So comments and suggestions on our approach and for new forecasts to include are welcome.

Just as they did last week, all the different sources point to the Conservatives being comfortably the largest party, with heavy losses for Labour and modest gains for the Liberal Democrats and Scottish National Party (SNP). Last week the betting markets suggested a smaller Tory tally than did the forecasting models. The models haven’t changed much but the betting markets have moved into line with forecasts. On average across betting markets, and complex and simple models, the Tories are expected to win with a comfortable majority of 60, barely changed from 57 last week. All three sources now suggest a majority of 50 or more.

Seats Betting Markets Complex models Simple models Average
Con 352 360 353 355
Lab 210 201 193 201
LD 37 25 30 31
Brexit 0 0 0
Green 2 1 1 1
SNP 46 48 50 48
PC 5 4 4 4
Con majority 54 70 56 60

Conservative Seats - 13th Nov

Continue reading Second combined forecast for the 2019 general election

First combined forecast for the 2019 general election

By Stephen Fisher, John Kenny and Rosalind Shorrocks (Universities of Oxford, Southampton and Manchester respectively)

There aren’t so many different forecasts for the general election out yet, but enough to start looking at how they compare. This is the first of hopefully weekly blogs where we review the different forecasts from different methods and combine them into an overall forecast. At the moment, the polls and seats forecasts suggest a comfortable Conservative majority but citizens and betting markets are not so sure it will happen.

The idea of combining forecasts from different sources has a good track record, though it has to be admitted that our attempts for the 2017 general election and the 2016 Brexit referendum did not work out well. We will write more about those experiences soon. Also worth noting is the experience of the pollyvote.com combined forecast of the US presidential elections.

Here we aggregate seats and vote share forecasts from a variety of sources including betting markets, polls, statistical forecasting models and citizen forecasts. As well as updating weekly, the methodology (as detailed below) might well evolve. So comments and suggestions on our approach and for new forecasts to include are welcome.

Continue reading First combined forecast for the 2019 general election