By Stephen Fisher, John Kenny and Rosalind Shorrocks.
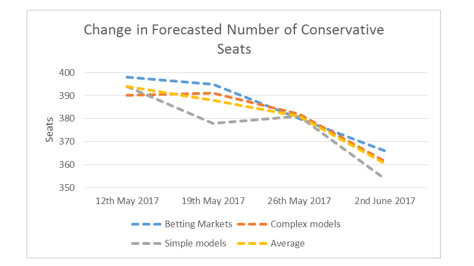
Our final combined forecast is for a Conservative majority 66. This estimate is down only slightly from 70 on Friday last week, but well down on the 132 majority we first forecast on 12th May. All three sources on average each suggest that net gains for the Conservatives will largely be at the expense of Labour and the SNP, with tallies for other parties little changed from 2015.
| Seats |
Betting Markets |
Complex models |
Simple models |
Average |
| Con |
371 |
361 |
343 |
358 |
| Lab |
199 |
214 |
228 |
214 |
| LD |
11 |
7 |
7 |
8 |
| UKIP |
0 |
0 |
0 |
0 |
| Green |
1 |
1 |
1 |
1 |
| SNP |
46 |
46 |
50 |
47 |
| PC |
3 |
3 |
3 |
3 |
| Con majority |
92 |
72 |
36 |
66 |
The combined probability of a Conservative majority is now 72%. This is little changed from last week but down from 91% in our first combined forecast. The probability of a 100+ majority Conservative landslide is, at 11%, the same as last week but well down on the 71% we reported on 12th May. Betting markets are the most confident of a Tory majority. Citizens collectively express the most uncertainty, with both the highest probability on a Tory landslide and the second highest probability on the Conservatives losing their majority. Taking the most recent poll from each pollster, only just over half of them show the Conservatives with the lead of 6 points or more that would be needed for the party to win a majority on uniform change calculations. The 54% figure is down from 63% last week, but it reflects a change in who has done a poll this week more than how the pollsters from last week have seen their figures change.
|
Betting markets |
Models |
Polls |
Citizen forecast |
Average |
| Conservative Majority |
0.83 |
0.82 |
0.54 |
0.69 |
0.72 |
| Conservative landslide |
0.17 |
|
0.00 |
0.17 |
0.11 |
For our final forecast we have taken a straight average of the final polls published at the time of writing instead of relying on other poll aggregators. This average is for a strikingly similar Conservative lead as in the actual outcome last time 2015, 6.5 compared with 6.6 points. But the final polls last time pointed to a tie. The markets and models predict that the polls are over estimating Labour and under estimating the Conservatives again. Overall our combined forecast this week now suggests that the Conservatives will win with a 9.6 point lead. This estimate is down only slightly from 10.2 points last week. But there has been a massive drop from the 18.7 point lead predicted in our first combined forecast on 12th May.
|
Final Poll average |
Betting markets |
Models |
Average |
| Con |
43.0 |
45.8 |
44.3 |
44.4 |
| Lab |
36.5 |
34.7 |
33.1 |
34.8 |
| Lib Dem |
7.6 |
8.3 |
9.7 |
8.5 |
| UKIP |
4.4 |
3.4 |
4.7 |
4.1 |
| Green |
2.1 |
|
2.2 |
2.1 |
| SNP |
4.0 |
|
4.1 |
4.0 |
| PC |
0.6 |
|
0.8 |
0.7 |
| Con-Lab lead |
6.5 |
11.1 |
11.2 |
9.6 |
Methodology
The main changes in method this week are as follows.
Nigel Marriott in his final model now includes a forecast for party vote shares as well as the previous seat forecasts and so this is included; we have also added new models from Election Data, Elections Etc, Janta-Lipinski, Kantar Public, Michael Thrasher, Andreas Murr et al and Number Cruncher Politics. YouGov’s forecast model has been removed because they have officially dropped it. Betting market data for the forecasted party vote share of Labour, the Liberal Democrats and UKIP is gathered from Betfair/Betfair Exchange where such data is not available on Oddschecker.
Our polling average is now a simple average of the final polls.
As there have been five citizen surveys published since the 31st May, we have decided to limit the inclusion criteria for this so that only the most recent citizen survey from each survey company during this period is included.
Overall description of the method
Our basic approach is to combine forecasts by averaging them within each category and then taking the average across categories. Since the different sources do not all present equally clear figures that can be averaged on a like for like basis we have made various judgement calls on how to treat the data.
Historically the idea of combining forecasts from different sources has had a good track record, though it has to be admitted that our attempt to do one for the EU referendum did not work out well. Most recently the pollyvote.com combined forecast of the US presidential election last year was 2 points out on the share of the vote.
Polls
Our polling average is now a simple average of the final polls. Previously for vote shares, we use the various available polling averages, or ‘polls of polls’, and take their average. We exclude polling averages for whom the most recently published polling average is more than a week old. There are a number of different polling averages. They are in truth nowcasts rather than forecasts, but we are in effect treating them as forecasts. Some admittedly are quite sophisticated, allowing for pollster (aka house) effects, but they are nonetheless estimates of current public opinion and not future votes.
We do not attempt to say what seats outcome is implied by polls (that is the job of the modellers). However, since statistical models are rarely if ever clear about the probabilities their models place on key events like a Conservative majority and a 100+ majority, we have included in the probabilities table some pseudo-probabilities from the polls. Taking the most recent poll published by each pollster in the last week, we calculate the proportion showing a Conservative lead over Labour of more than 6 points as the pseudo-probability of a Conservative majority, but we allow polls with exactly a 6 point lead to contribute a 0.5 to the average. Using the same polls, we use the proportion showing a Conservative lead over Labour of 16 points or more as the pseudo-probability of a Conservative landslide. These thresholds of 6 and 16 points are based on what would be required under uniform swing assumptions for the Conservatives to win a bare majority and a 100+ majority respectively.
Betting markets
There are numerous betting markets for the various outcomes in the election. We have taken those that are most helpful for the four forecasts we want to produce. For seat shares, we take the mid-point of the spread as the seat share, and average these mid-points between different sources. Note that the markets imply fewer seats forecast than there are actually are in the House of Commons. This is because the markets are separate for each party and do not need to be consistent collectively.
For vote share, we use betting markets for the Conservatives, Labour, the Liberal Democrats and UKIP. (Vote share markets for other parties are unavailable either on the betting market aggregation site Oddschecker of Betfair/Betfair Exchange). Odds are given for 5-point ranges of vote share. We take a weighted sum of the mid-points of these ranges where the weights are the implied probabilities. For the top and bottom options we use 2.5% above/below the upper/lower bound (e.g. 52.5 for “Above 50” and 27.5 for “Below 30”). The weighted sum is calculated just using the three categories with the largest implied probabilities, because the probabilities for other categories are so small and unstable. For UKIP we use just the two most likely categories.
For the probability of a Conservative majority we give an average of the implied probability from sites offering this market. For the probability of a Conservative landslide, we use the combined prices PredictIt that the Conservatives will win 370-379 seats, 380-389 seats, and 390 or more seats. This really represents a majority of 90 or more but that was as close as we could get to 100.
Statistical models
There are numerous statistical forecasting models this year. We have divided them into two categories: simple (poll average plus uniform swing seats projection) and complex (anything more elaborate than the simple models, although they are not necessarily particularly complex). Some make adjustments for long run differences between pollsters, for constituency variation, and some estimate by how much things will differ between current polls and the eventual result. Chris Hanretty’s forecast at electionforecast.co.uk does all of these things. Within these categories we simply average the available estimates of seats and shares. In addition, as discussed above, we have separated those models based on the local election results into a separate category.
We should note that not all of the models are the modellers’ favourite. Some are counterpoints to their main models for comparison. We have included these on the basis that they are still talked of and expected to be reasonable estimates, for example, at Electoral Calculus, Martin Baxter has a local election results based model. We have not excluded any models based on our judgement of quality, but they do have to be statistical models as opposed to personal guesses.
Citizen forecasts
Some polls ask people what they think that the outcome will be on June 8th. Different pollsters use different survey questions but they can be combined to generate pseudo-probabilities. We use the proportion of poll respondents who think the Conservatives will win/there will be a Conservative majority, excluding don’t knows and re-percentaging, as the pseudo-probability of a Conservative majority. We similarly use the proportion of poll respondents who think that there will be a Conservative landslide/the Conservatives will win more than 100 seats, for the probability of a Conservative landslide.
Note: Estimates come from around 9am on the morning of 8th June 2017. In all seat estimates, the Speaker’s seat is counted as Conservative.
Sources
There sources we used are listed below in no particular order. Please let us know of any that you think we have missed or misclassified. Some polling averages we know of were not included because they were more than a week old.
Prediction markets:
IG
Predictit
Sporting index
Oddschecker
Betfair Predicts
Betfair
Betfair Exchange
Complex Forecasting Models:
Chris Prosser
ElectionForecast.co.uk (Chris Hanretty)
Electoral Calculus (main and local election forecast)
Election Data
Elections Etc
Forecast UK
Janta-Lipinski
Kantar Public
Lord Ashcroft
Michael Thrasher
Murr, Stegmaier and Lewis-Beck
Nigel Marriott
Number Cruncher Politics
PME Politics (Patrick English)
UK-Elect
Simple forecasting models (polling average + uniform swing):
Electionpolling
Principalfish
Polling Averages (less than a week old):
Telegraph
FT
Britain Elects
Electionforecast.co.uk
NewStatesman
Electionpolling
Principalfish
The CrossTab
Citizen forecasts:
YouGov (here)
ComRes (here)
ICM (here)
Opinium (here)
Survation (here)
The three authors are equal contributors and our names are in alphabetical order.

 At the beginning of May there was very little gender gap. The Conservative lead was much the same for men as for women. For polls conducted in the past week, on average the Conservatives still had a large, 14-point lead amongst men, but only a small, 4-point lead amongst women. Compared with the start of May, women are now 7 points more likely to vote Labour than men, and 3 points less likely to vote Conservative.
 They show that the Conservative lead has dropped for both genders and for all age groups. (For those under 35 the Conservative lead is negative, and so dropping means Labour moving even further into the lead for this group). The drop for women is much larger than it is for men, and it is concentrated in particular age groups.