Category Archives: Wales

Forecasting Local Election net seat gains/losses 2022

by Stephen Fisher, 3rd May 2022.

There are local elections tomorrow in England, Scotland, and Wales. Table 1 below shows my forecasts for net seat changes for each. They are based on projecting changes in opinion poll performance since the last round of local elections, with different methods for the different countries as discussed below. They represent what we might expect if the changes in party performance in local elections are on par with changes in the opinion polls.

Table 1. Forecasts for English local election net seat gains/losses for 2022

EnglandWalesScotlandOverall
Con-165-80-36-281
Lab+140+80+84+304
LD+700+6+76
PC 0 0
SNP  -24-24

The Conservatives are expected to lose seats in all three countries. They are defending a strong 2017 base in Scotland and Wales, and dropped in the polls since both 2017 and 2018 when the English seats were last fought. 

Labour are expected to be the main beneficiaries from Conservative losses. The projections suggest Labour might recover most but not all the losses they suffered in 2017 in Scotland and Wales. In England, Labour are trying this week to build on cumulative gains from 2010, 2014 and 2018. They already control over half the seats up this year. Since Labour are at 40% in the polls, their poll support is no greater than is was in 2018. Instead of gaining seats from winning more voters, Labour are projected to make council seat gains in England primarily from the drop in the Conservative vote. But, as discussed below, last-year’s experience shows there are various reasons why that might not happen. 

Perhaps most surprising of the forecasts is the projected drop in SNP seats from what was considered a disappointing performance in 2017, winning only 32% of the first-preference vote when typically the party has been winning at least 45% of the vote in Scotland-wide elections since the independence referendum in 2014. My projection for the Scottish locals this week is based on changes since 2017 in local-election first-preference vote intention polls. Even general-election vote-intention polls show no advance on 2017 for the SNP. The party will be hoping that more of the people who vote for them in Westminster and Holyrood elections will support them in the locals this week. 

England

Typically, the Conservatives lose English council seats when their lead over Labour in the opinion polls drops from what it was the last time the election was fought. Similarly, if the Tories extend their lead, then they typically make net gains. The graph below shows that pattern for local elections in England when the Conservatives were in government and the local elections were not on the same day as a general election. There is a strong correlation, but with a lot of noise around it, meaning any forecast comes with a big range of uncertainty. This year either of the two main parties could be either up or down by more than 100 seats based on the variation in previous local elections.

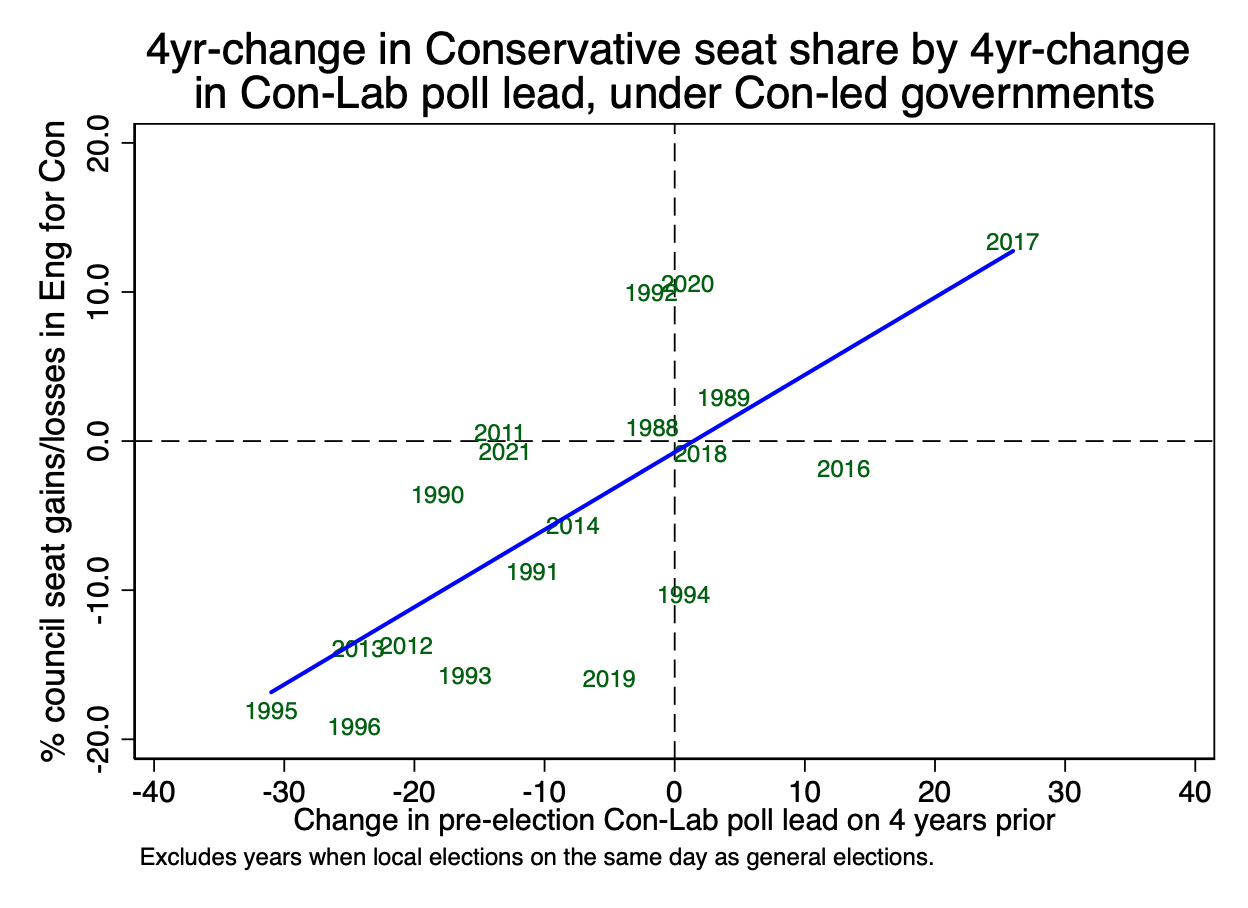
Last year’s local elections contributed to that noise. The graph above distinguishes between what happened in the elections that were delayed from 2020 because of the Covid pandemic, and those that happened in 2021 as scheduled. The Conservatives substantially outperformed expectations from the historical pattern for both sets of elections. They made +248 gains in the “2020” set despite polls (in 2021) showing only a 1-point increase in the Con-Lab lead since 2016. For the 2021 set, the Tories suffered a net loss of only 14 seats despite the poll lead dropping by 13 points from the high that Theresa May enjoyed in the 2017 local elections (before losing most of it at the general election the following month).

Continue reading Forecasting Local Election net seat gains/losses 2022

What does it take to get elected in Scotland and Wales?

By Stephen Fisher, 6th May 2021.

There is speculation about how well various new and small parties will do in today’s elections to the Scottish and Welsh Parliaments. Former SNP First-Minister Alex Salmond has recently established the Alba Party, while George Galloway has created Unity 4 All. Both are contesting regional list seats in Scotland. Meanwhile, Abolish the Welsh Assembly has come fourth, with at least 6% of the regional list vote, in all four polls for the Welsh Parliament (Senedd Cymru) since mid-April. Also, Reform-UK, the renamed Brexit Party, is fielding candidates in both countries. These are just some of the various contenders.

This post explains some of the complications in trying to figure out what share of the vote a party needs to get elected in these institutions. It ends up pointing to past experience as a guide and drawing comparison with and the electoral system for the Greater London Assembly (GLA).  

TLDR: The experience of all five elections to the Scottish Parliament suggests that around 5.5% of a regional list vote is usually enough to win a seat. It would be rare, but not impossible, to miss out on a seat with 6%. Winning on 5.2% to 5.4% is not uncommon. The lowest D’Hondt ratio ever to yield a seat in Scotland was 4.6% (equivalent to a single party winning a seat on that share). That was in 2003 when the SNP won 5 seats, including 2 list seats, with 23.0% of the Mid Scotland and Fife list vote. For the Senedd, a share of around 6.5% in a region is likely to be enough, especially in North Wales and Mid and West Wales which have historically been more accessible to small parties. By comparison, the GLA has a 5% legal threshold, without which parties would get seats with 3.8% of the vote.

Scotland

The Scottish Parliament has 129 seats. The electoral system is sometimes described as proportional, but it is significantly different from pure proportional representation. If it were close then a party would win a seat for roughly every 0.8% of the vote, since 100/129=0.8. More precisely, if all the seats were elected by the D’Hondt method of proportional representation a party would be guaranteed a seat with more than 100/(1+Number of seats) per cent of the vote, that is 100/130 = 0.77% of the vote. As we shall see that is much lower than what is actually required to get elected.

Continue reading What does it take to get elected in Scotland and Wales?

Welsh Local Election Forecasts 2017

by Stephen Fisher.

Update 18.40, 4.5.17: I was mistaken as to the method for the Rallings and Thrasher projection, the details have now been corrected. Nothing about my forecast has changed. 

This is definitely just for curiosity value only! Last week Roger Scully released the results of his Welsh Political Barometer survey which included Westminster and local election vote intention questions see here. The changes on the comparable survey from just before the last main round of Welsh local elections five years ago are presented in the first and third columns of the table below. Colin Rallings and Michael Thrasher did a seat projection based on the change from the actual 2012/3 local election vote share to the 2017 local-vote intention poll (Con +13, Lab -8, LD -1, PC +3), as discussed by Roger Scully here and listed in the second column of the table.

%Local vote Rallings & Thrasher %GE vote Regression
12-17 change seat change 12-17 change seat change
CON +9 +90 +17 +272
LAB -20 -130 -20 -320
LD 0 0 +1 +12
PC +2 +20 +1 +16

The final column of the table represents my attempt to translate the changes in the Westminster vote intention into changes in local election seats, similarly to the way I did for the English local elections. Regression analysis of local election results in Wales since 1995 shows strong linear relationships between votes and seats for each of the main parties, with the partial exception of the Liberal Democrats. On average the main parties have picked up around 16 extra seats for every percentage point extra in the overall share of the vote (just 12 for the Lib Dems).

If this relationship were to continue and if the changes in the opinion polls since 2012 were to be reflected in the results then the numbers of gains and losses would be much bigger than suggested in the Rallings and Thrasher projection. For instance Labour would be expected to lose 320 not just 130 seats.

By implication the geography of local election voting must be doing a lot of work to dampen the scale of gains and losses for the Conservatives and Labour parties in the Rallings and Thrasher projection. It would seem that there are a lot very safe Labour council seats in Wales and the system is extremely biased to Labour. The Rallings and Thrasher projection implies that the Labour would win with a 2 point lead over the Conservatives in votes, but more than twice as many seats (450 to 195). That would be extraordinarily unjust.

Projecting the changes in the Westminster vote intention on to seats with the regression method (final two columns) suggests the Conservatives will emerge (for the first time in a long time) with a substantial lead in both votes and seats.

Thanks to Eilidh Macfarlane for help with the data.

How did Labour hold up so well in Wales?

by Stephen Fisher

In the Scottish Parliament elections yesterday the SNP lost 6 seats and their majority because their share of the list vote fell by 2 points. They ended up with 49% of the seats from 42% of the vote. Meanwhile, at the Welsh Assembly elections Labour’s vote share dropped by 5.4% points but they lost just one seat, finishing with 48.3% of the seats from just 31.5% of the vote.

Why was the Welsh system so much more generous to Labour than the Scottish system was to the SNP? Continue reading How did Labour hold up so well in Wales?