by John Curtice, Stephen Fisher, and Patrick English, 7th May 2026.
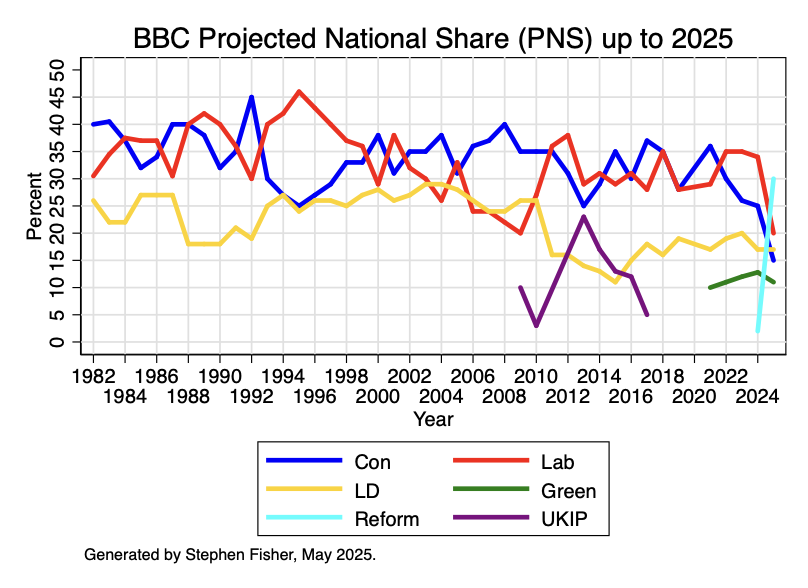
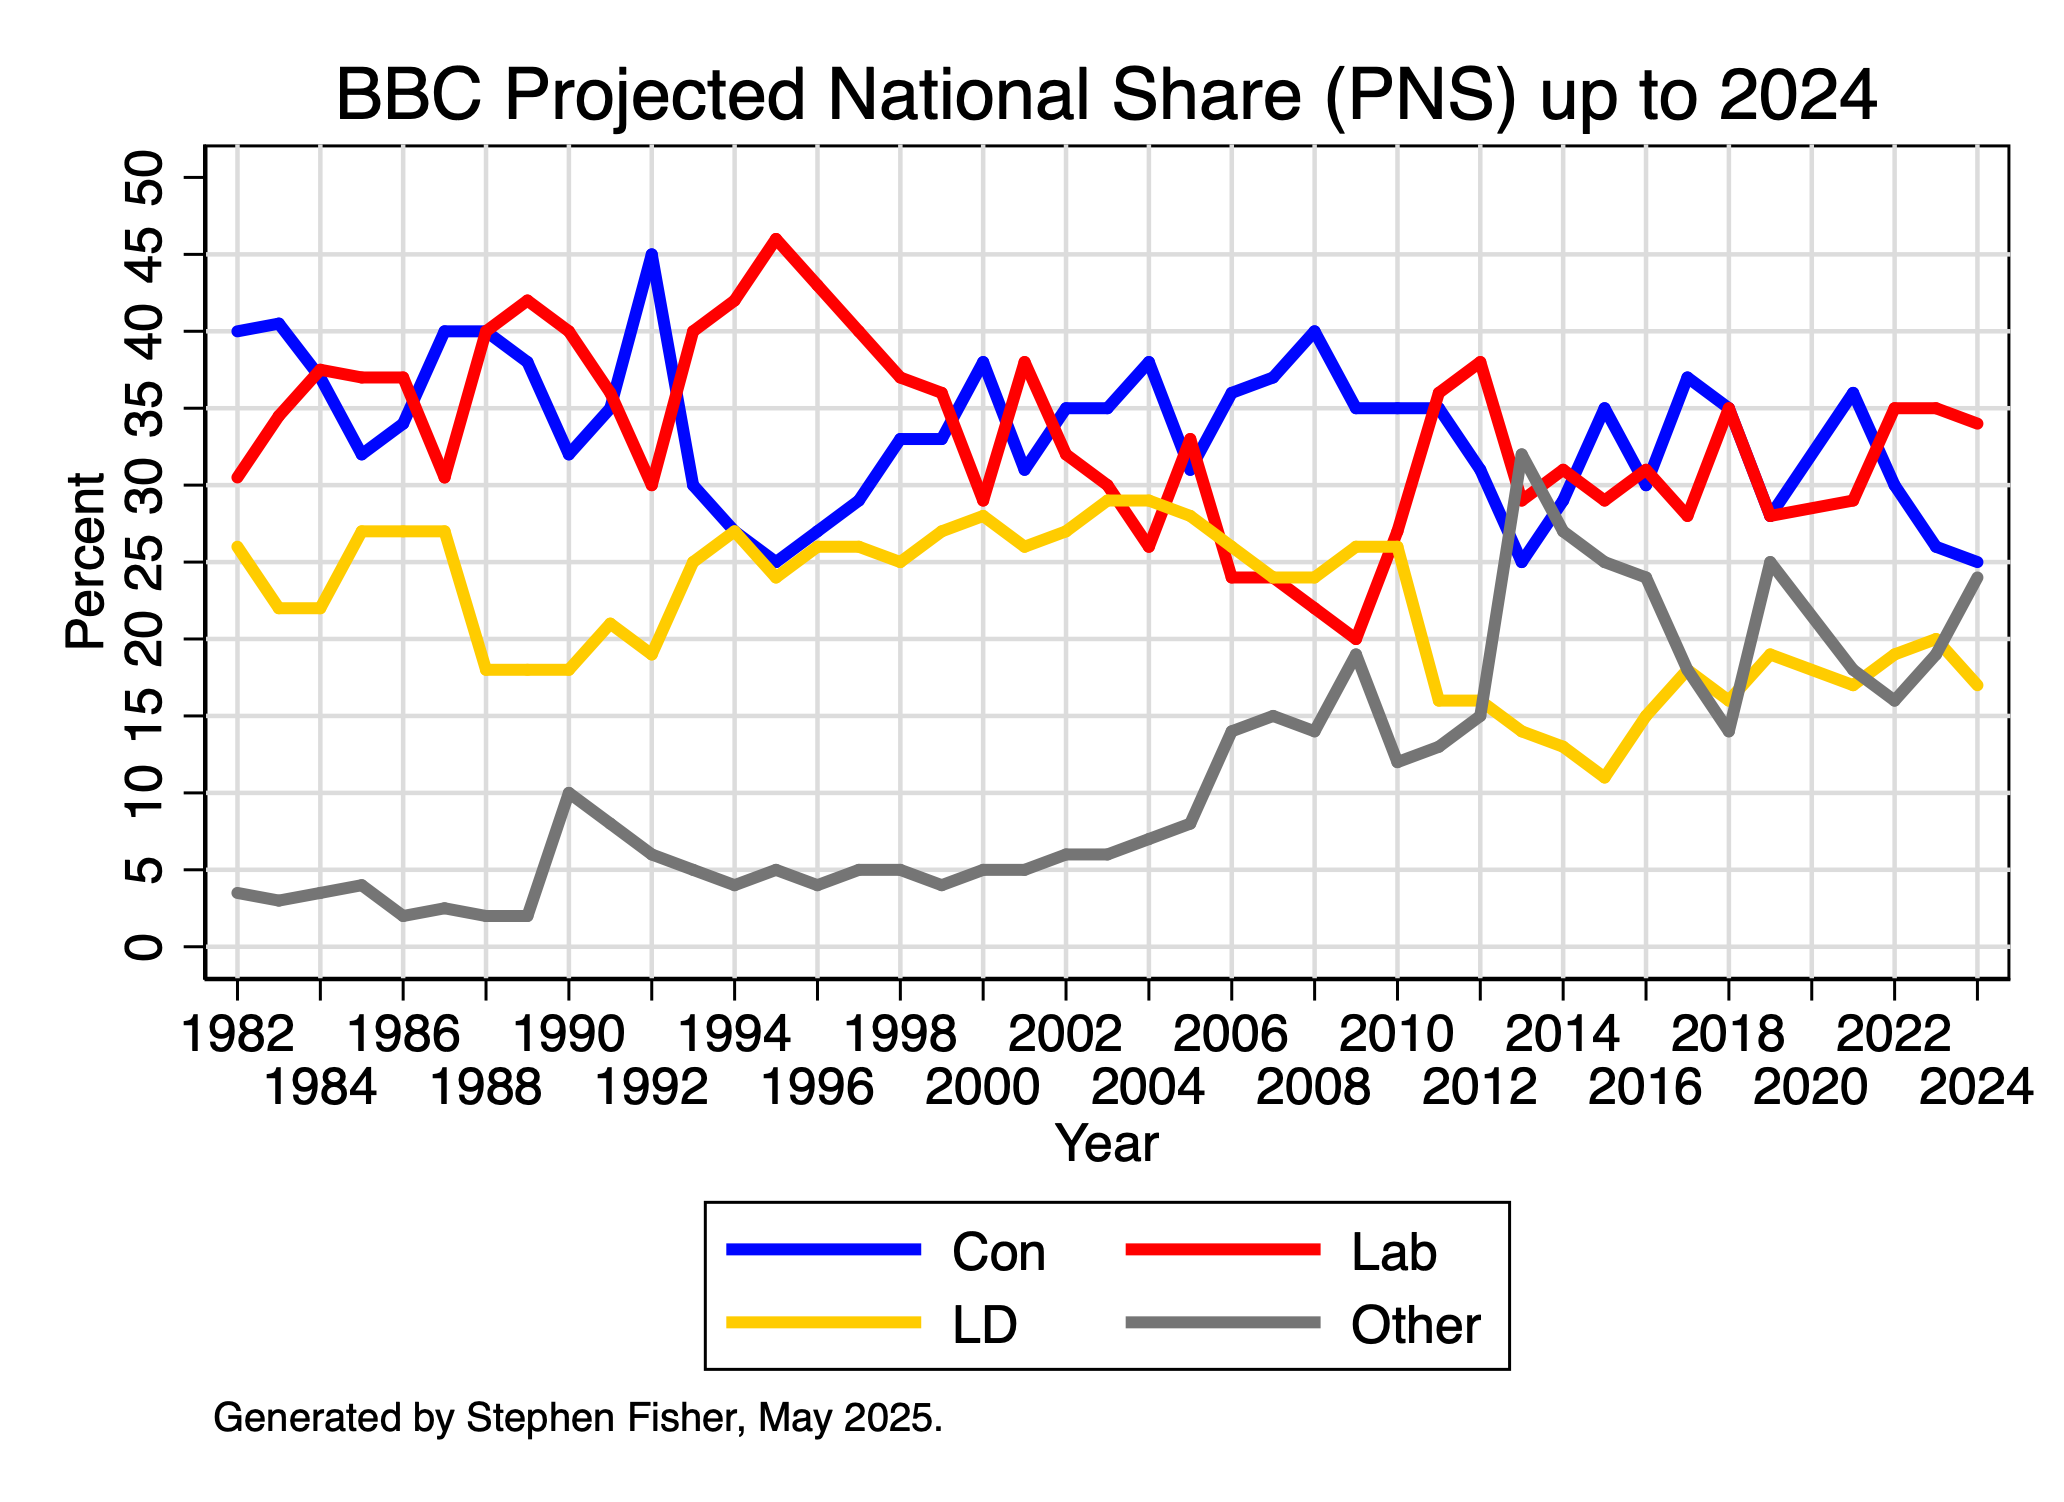
One of the highlights of the BBC’s coverage of local elections is the Projected National Share (PNS). This is an estimate of what the GB share of the vote would have been if (a) local elections had been held everywhere, (b) the outcome where there were no elections mirrored the pattern where there were, and (c) the principal parties contested all the seats.
Although there are devolved elections in Scotland and Wales today, the PNS is always based entirely on local election results in England. This means that the PNS this year will tell us about what would have happened if voters across the whole of Britain had local elections and the results mirrored what happened in the particular parts of England with local elections this year. It will not take account of the results of the entirely separate devolved elections in Scotland and Wales. To that extent, even though the PNS is expressed as a GB share of the vote, it is best thought of as an indicator of political developments in England.
A key virtue of the PNS is that it provides a summary statistic that is comparable across local election years irrespective of the particular mix of places in England that have local elections in any particular year, a mix that varies considerably from year to year.
This year’s local elections, for example, take place primarily in urban England, including all of London. Consequently, they are places where Labour has hitherto at least been relatively strong. They are also places that on average voted for the UK to Remain in the EU at the 2016 referendum even though Britain as a whole voted to Leave. The PNS is designed, among other things, to remove this unrepresentative character.
In this blog we outline some of the challenges in estimating a PNS and explain how we are addressing them.
Continue reading Understanding the Local Elections Projected National Share (PNS) in 2026