Why did the UK vote to leave the European Union?

by Stephen Fisher.

It is not hard to see why Leave won. Evidence from numerous opinion polls showed that there was a clear majority for Leave on the basis of concerns about immigration and beliefs that leaving would reduce immigration. Moreover the same opinion polls showed us that there was no compensating majority who believed that the UK would be worse off if we left. Still less did people feel that they personally would be financially worse off. For further details see here.

Although it should not have come as a surprise that Leave won, the result was close enough that it could easily have gone the other way. There will be much debate as to whether the Remain side could have made their arguments more persuasively and campaigned more effectively. With such a close result a host of relatively small differences could all have made a difference. It will be hard for survey and other academic research to identify what, if anything was decisive.

Turnout, at 72%, was the highest for any UK-wide vote since 1992. Whilst this might constitute a relatively high level of participation by recent standards, it does still mean that 28% of registered voters did not bother to have their say in what, we were frequently told, was the most important national decision in our lifetimes. If opinion poll questions on likelihood of voting are at least roughly right, it is likely to transpire that non-voters more often favoured remaining. Moreover it is probably the case that if everyone eligible had voted then the UK would have chosen to Remain.

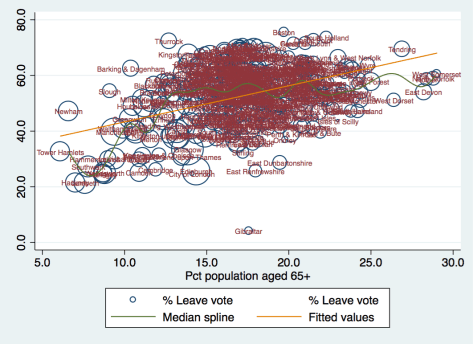
The local authority results provide some evidence that the divisions in society suggested by the opinion polls as important for referendum voting were born out. Places with more pensioners were more likely to vote for Leave.

leaverefsh_c11age65p_graph

The Remain vote was higher where there were more graduates.

leaverefsh_c11degree_graph.png

These are geographical manifestations of primarily individual-level differences. There are also others related to ethnic diversity and economic prosperity.

The national divides are the most notable aspect of the political geography. Both Northern Ireland and Scotland voted Remain (at 56% and 62% respectively). Both England and Wales voted 53% Leave.

The only region within England to vote Remain was London, and it did so strongly with 60% of the vote. Setting aside London, the rest of England voted solidly, 55%, for Leave. While it is true that the Leave vote was strongest in the English countryside, many of the big cities voted Leave, including Birmingham, Sheffield, Bradford, Sunderland, Bolton, Newcastle, and Stoke. While the North and Midlands were stronger for Leave than the South of England, there were cities in the South, such as Plymouth, Southampton and Swindon, that voted Leave.

In the end only 52 out of 293 local authorities in England outside London voted to Remain. Similarly only 5 out of 22 Welsh council areas voted to Remain. Outside London, the preference for leave was widespread in England and Wales.


Final forecast from the Historical Referendums and Polls based method

by Stephen Fisher and Alan Renwick.

The polls this week have been better for Remain than they were last week. Since this is our final forecast it makes sense for us to restrict our sample of polls to include in our polling average just the most recent poll from each company (or company-mode combination) over the last week. If we do this then our polling average finds Remain at 51 per cent after setting aside Don’t Knows. This is up two points from our polling average on Sunday. The two-point difference is partly due to restricting the sample from two weeks to just one, partly rounding error and partly to the fact that more of the polls than previously include Northern Ireland. So it is not clear whether the apparent movement towards Remain is real or not.

Our forecast share of the vote is 52 per cent for Remain, 48 per cent for Leave. This reflects an expectation of a 1.5-point rise in support for the status quo, based on the change that is visible on average between the final polls and the actual result in previous referendums in Britain or on the EU elsewhere. While this reflects the average historical experience we have explained here and here why the average may not be a very reliable guide.

The unreliability means there is a lot of uncertainty in our forecast. The 95 per cent prediction interval is considerably narrower than it was at the beginning of the week. But at ±10 points it is still very wide. So wide that Remain could reasonably be expected to get anywhere between 42 per cent and 62 per cent of the vote. Neither a comfortable Remain victory nor a comfortable Leave victory can be ruled out.

That said not all the possible outcomes in this range are equally likely. Our forecast probability that Remain will win the referendum is 64 per cent.

The methods behind our forecast

Continue reading Final forecast from the Historical Referendums and Polls based method

Final combined EU Referendum forecast

by Stephen Fisher and Rosalind Shorrocks.

This forecast is based on data collected late on 22nd June. Yet again this method suggests Remain is most likely to win but there is a considerable chance that Leave may win. The probability that Remain will win is up from 62.3% on Sunday to 66.5% now. This reflects both better opinion polls in recent days and so polling models more favourable for Remain, and greater market confidence in a status quo victory.
The only component forecast that is less favourable to Remain is the citizen forecasts, and that is because we have restricted our sample to citizen forecasts over the last week. They are noticeably more equivocal.
The forecast share of the vote is once again little changed, with Remain predicted to get 53.3% and Leave 46.7% per cent of the vote.
Remain % share Leave % share Probability Remain wins
Betting markets 53.5 46.5 76.7
Prediction markets 73.4
Citizen forecasts  52.0  48.0 55.2
Expert forecasts 55.1 44.9  62.0
Volunteer forecasts 54.0 46.0 74.0
Polls 50.6 49.4 55.6
Poll based models 52.5 47.5 68.5
Non-poll based models 55.6 44.4
Combined forecast (mean) 53.3 46.7 66.5

(Individual forecasts collected on the evening of 22nd June 2016.)

There is another poll due during polling day but that would be unlikely to change our polling average. The markets may change, possibly dramatically during the day if people on the betting and prediction markets are following trends financial markets.

METHODOLOGY Continue reading Final combined EU Referendum forecast

How the BBC will be benchmarking the results on EU referendum night

by John Curtice and Stephen Fisher.

Referendum night is going to represent something of a departure from usual. There will not be the drama of an exit poll announcement to stir excitement – and possibly shock – at 10pm. Meanwhile, when the actual results do start to be announced, except in Northern Ireland they will not be declared by the parliamentary constituencies with which we have all become familiar. Rather they will be unveiled local authority by local authority. As a result, we will get just one declaration for the whole of Birmingham, while, at the other end of the spectrum, the Isles of Scilly will get their moment in the sun.

But perhaps the biggest departure from the routine of election night will be that there will be no ‘last time’ against which to compare the results as they are declared. So when Sunderland or Swindon announce their result we will not be able to say whether it represents a ‘swing’ to Remain or Leave – and thus for which side, if either, it represents a good result.

To overcome this problem we have, on behalf of the BBC, been beavering away at establishing which local authorities appear to be more likely to record a relatively strong vote for Remain, which are the ones where Leave can be expected to do relatively well, and which are the council areas where the two sides could be expected to be equally matched. Our evidence has come primarily from a dataset of over 61,000 interviews about people’s attitudes towards the EU. These interviews were conducted with people in Great Britain by YouGov between March of last year and March of this year and we are deeply grateful to the company for making these data available.

Continue reading How the BBC will be benchmarking the results on EU referendum night

Do people tend to vote against change in referendums?

by Stephen Fisher and Alan Renwick.

It is commonly asserted by people commenting on the EU referendum that people tend to be risk averse and so vote against change. The Prime Minister appealed to people not to “roll the dice” on their children’s and grandchildren’s future. Daniel Hannan in his book Why Vote Leave accepted the idea of risk aversion in referendums, and then argued that people should see remaining in the EU as more risky than leaving.

But is it really true that people tend to vote against change in referendums? There are certainly several examples in Britain where people have rejected change, the most prominent examples include the referendums on Scottish Independence, the Alternative Vote electoral system, and, in 1975, the UK’s membership of the European Community. But it is also true that people in different parts of Britain have voted for change in referendums on numerous occasions. They voted for a Scottish Parliament (and separately to give it tax varying powers), a Welsh Assembly (and later for it to have more power), a Greater London Assembly, and the Good Friday Agreement. Setting aside referendums at the sub-regional level, the change option has won in six out of the thirteen referendums that have been held in the UK.

It maybe objected that both of the UK wide referendum results have been for the status-quo. True. So what if we cast our net further afield?

Continue reading Do people tend to vote against change in referendums?

What is going on in the EU referendum? Some comments based on opinion poll evidence

by Stephen Fisher.

The prominent Leave campaigners are at pains to point out how much they love Europe. Boris Johnston says he is a proud European. Leavers claim to love Europe but hate the EU.

Meanwhile leading figures in the Remain camp dare not admit to any fondness for either Europe or the EU. Their eurosceptic tone emphasises UK membership as a marriage of convenience, to be justified by considerations of UK interests alone. This makes plenty of sense as a pitch to a population that overwhelmingly dislikes the institutions of the EU and who identify with Britain or one of the home nations much more than they think of themselves as European.

For the large majority of people in the UK pretty much the only substantial reason for voting Remain is economic. “Project Fear” is not only the obvious strategy for the Remain campaign, it is pretty much the only possible one that could secure them victory. The main reason why the polls are suggesting the outcome of this referendum will be close is that the public are not yet convinced the economy will suffer, and in particular that they personally would be worse off, if we left.

Continue reading What is going on in the EU referendum? Some comments based on opinion poll evidence

Updated combined EU Referendum Forecast

by Stephen Fisher and Rosalind Shorrocks.

We offer our condolences to the family and friends of Jo Cox MP. We hope that it is not disrespectful of us to post this updated forecast now that the official campaigns have resumed.

Remain % share Leave % share Probability Remain wins
Betting markets 52.0 48.0 66.5
Prediction markets 65.6
Citizen forecasts  52.0  48.0 62.1
Expert forecasts 55.1 44.9  62.0
Volunteer forecasts 54.3 45.7 71.3
Polls 48.5 51.5 46.0
Poll based models 50.5 49.5 55.0
Non-poll based models 55.6 44.4
Combined forecast (mean) 52.6 47.4 62.3

(Individual forecasts collected on 18th June 2016.)

METHODOLOGY Continue reading Updated combined EU Referendum Forecast

Forecast update for the Historical Referendums and Polls based method

by Stephen Fisher and Alan Renwick.

We offer our condolences to the family and friends of Jo Cox MP. We hope that it is not disrespectful of us to post this updated forecast now that the official campaigns have resumed.

Our polling average now has Remain at 49% after setting aside Don’t Knows.

From this we forecast Remain to get 50% of the vote.

The 95% prediction interval is only a little narrower than ±12 points. So Remain are forecast to win between 39% and 62% of the vote.

The probability that Remain will win the referendum is now 52%.

The methods behind our forecast

The method behind this forecast is based on the historical experience of referendum polls and referendum outcomes in the UK and on the EU elsewhere, as discussed here.

Our polling average is constructed by taking the most recent poll from each company within the last two weeks. If a company uses both phone and online modes then both the most recent phone poll and most recent online poll are used. This applies to BMG, ICM and ORB this week. The current average is based on the results of twelve polls from nine companies, of which six were conducted by phone and six online. All polls are adjusted to account for the tendency for phone polls to be more favourable to Remain. This is done by adding 1.75 to the Remain share for online polls and subtracting the same amount for phone polls.

Updated combined EU Referendum forecast

Stephen Fisher and Rosalind Shorrocks.

This week’s forecast shows a sharp drop in the probability of a Remain win to 60.6%, down from 67.7% last week. Similarly the forecast share of the vote for Remain has dropped from 53.8% to 52.7%. For the first time, our poll of polls of polls has Leave ahead, and more of the polls under consideration (see below for details) have had Leave ahead than have had Remain ahead. There has been little or no change in the expert forecasts and non-poll based models because of little or no new data. However there have been substantial changes in the betting and prediction markets, largely in response to the opinion polls. Intriguingly the volunteer forecasters at the Good Judgement Project now 72% chance to Remain, more than 10 points higher than the corresponding figure from the prediction markets: the biggest gap between these sources we’ve observed so far.

Remain % share Leave % share Probability Remain wins
Betting markets 51.5 48.5 60.7
Prediction markets 60.1
Citizen forecasts  52.0  48.0 64.4
Expert forecasts 55.1 44.9  62.0
Volunteer forecasts 54.2 45.8 72.2
Polls 49.6 50.4 45.7
Poll based models 51.0 49.0 59.0
Non-poll based models 55.6 44.4
Combined forecast (mean) 52.7 47.3 60.6

(Individual forecasts collected on 14th June 2016.)

METHODOLOGY Continue reading Updated combined EU Referendum forecast

A 50:50 forecast from the Historical Referendums and Polls based method

by Stephen Fisher and Alan Renwick.

Our forecast has taken a dramatic turn. Last week our polling average had Remain at 51% after setting aside Don’t Knows. It has this week dropped a further two points to 49%. This means Leave is ahead in our polling average for the first time, with 51%.

The forecast share of the vote for Remain has correspondingly dropped from 53% to slightly over 50%.

The 95% prediction interval is still ±12 points. So we are now forecasting that both Leave and Remain will win between 38% and 62% of the vote.

The probability that Remain will win the referendum has fallen from 68% last week to just 51% this week. Continue reading A 50:50 forecast from the Historical Referendums and Polls based method