Final combined forecast for the 2019 general election

By Stephen Fisher, John Kenny and Rosalind Shorrocks

Since our first combined forecast at the start of the campaign, the number of forecasts for this general election has grown substantially. All of the combined forecasts – seats, vote shares, and probabilities – are pointing to a Conservative majority. However, some individual forecasts do predict a hung parliament, and there is variation within each forecast type over how certain this majority is, and how large it is predicted to be.

SEATS

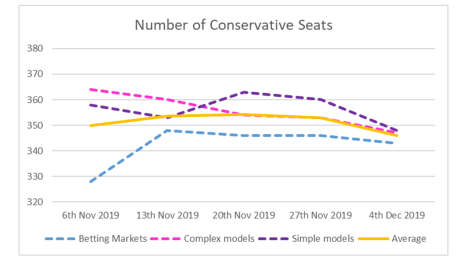
Seat projections from the betting markets, complex models, and simple models are all very similar, forecasting a Conservative majority of between 343 and 351 seats. The average number of seats across all forecasts that the Conservatives are expected to win – 341 – is slightly lower but ultimately very similar to the forecast last week.

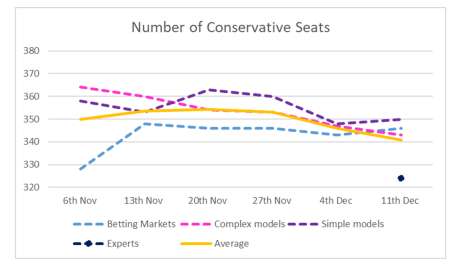
Since last week the Political Studies Association have published their Expert Survey, in which the average expected number of Conservative seats suggests a hung parliament with the Conservatives just shy of a majority. It is interesting that the experts surveyed by the PSA predict the Conservatives will win fewer seats than is currently suggested by the polls. Perhaps they are factoring in the same kind of late-campaign changes as observed in 2017 – although it should be noted that when a similar kind of survey was run for the EU referendum in 2016, the average predicted vote share for Remain and Leave amongst experts was the furthest away from the actual result than any of the other types of forecast. They also predicted a Conservative majority in 2017, although that prediction was made much more earlier in the campaign when the Conservatives had considerable leads over Labour in the polls.

Seats Betting Markets Complex models Simple models Experts Average
Con 346 343 350 324 341
Lab 221 225 219 233 224
LD 18 17 18 25 19
Brexit 0 0 0 2 1
Green 1 1 1 2 1
SNP 43 44 41 42 43
PC 4 3 3 4 4
Con majority 42 37 49 -2 31


Conservative Seats - 11th December

The similarity between the seat projections from most sources hides considerable variation within one particular forecast type – complex models. These models range from predicting 311 Conservative seats to 366 – the difference between a hung parliament and a healthy Conservative majority. They also range between 190 and 268 for Labour. It is particularly noteworthy that the voter expectation model, from Murr, Stegmaier, and Lewis-Beck, which uses citizen forecasts to predict the number of seats, forecasts one of the highest number of Conservative seats (360) and the lowest number of Labour seats (190). This is in contrast to our implied probability calculated from the citizen forecasts, which suggest that citizens are in general the least convinced about the likelihood of a Conservative majority compared to other forecasting methods. This suggests these surveys also suffer from being open to multiple interpretations and methods of analysis, as well as the question wording effects we discussed last week.

Continue reading Final combined forecast for the 2019 general election

The 2018 and 2019 local election results suggested the Conservatives might struggle to get a majority at the next general election

By Chris Prosser and Stephen Fisher.

Every May local election results are analysed as indicators of the state of the political parties and scrutinised for what they tell might tell us about the outcome of the next general election. That general election is tomorrow. Although a lot has happened in politics since May 2019, and especially since May 2018, it might be worthwhile reminding ourselves of what happened in the local elections then and what those results portend for the outcome this week.

In 2015, when the polls failed to anticipate a Conservative majority, one of the more successful forecasting models was Chris Prosser’s one based on the 2013 and 2014 rounds of local elections. Unlike the polls – which showed the Conservatives and Labour neck and neck – that model forecast a four point Conservative lead in vote share. Using a uniform change projection, the forecast shares predicted a Conservative tally of 296 seats for 2015, short of an overall majority but better than a uniform projection from the final opinion polls and the best of a set of twelve academic forecasting models for that election.

Applying the same method again, the table below shows that both the 2018 and 2019 rounds of local elections point to a clear lead for the Conservatives in a subsequent general election. However, the forecast shares of the vote from both rounds do not suggest a big enough lead for the Conservatives to be sure of an overall majority. On the average of the two set of vote shares, coupled with a uniform change projection (also using last night’s YouGov MrP projected SNP and PC vote shares) points to a very narrow Conservative majority of 8.

Party Forecast share based on 2018 results Forecast share based on 2019 results Average forecast share Standard Error of share forecast Seats forecast
Con 40.8 36 38.4 4 329
Lab 33.8 29 31.4 4 231
LD 13.4 15.4 14.4 4 23
Other 12 19.6 15.8 4 65

The fact that a forecast based on local elections 7 and 19 months ago should be so close to last night’s YouGov MrP projection of Con 339, Lab 231, LD 15 is remarkable. There is just a difference of 10 seats for the Tories and none for Labour.

Given that since the 2018 local elections we’ve had May’s Deal and the first missed Brexit deadline, and since the 2019 local elections we’ve seen Brexit Party and Lib Dem success in the European parliament elections, a new prime minister, a new Brexit withdrawal agreement, and another missed Brexit deadline, it is even more surprising that most opinion polls now do not differ profoundly from what previous local elections suggested would happen.

The Party Leadership Model predicts a Conservative overall majority

By Andreas Murr and Stephen Fisher.

Two years ago Andrew Adonis wrote a piece in Prospect arguing that Labour should ditch Jeremy Corbyn because of the importance of party leadership for electoral success. The piece claimed that “the best leader wins and nothing else matters,” and in Lord Adonis’s view Mr Corbyn is the worst Labour leader since Michael Foot. So, Adonis concluded already in September 2017, that regarding the next election “Corbyn will lose it decisively if he contests it.”

In response to Adonis’ claims many, including Danny Finkelstein, expressed skepticism about the power of leadership and pointed out that it is difficult to properly evaluate the quality of leaders in retrospect. Once we know who won and who lost we have a tendency to convince ourselves that the winner was a better leader than the loser. But there are ways of producing measures of leadership quality prior to elections which have historically been useful for forecasting election outcome.

The Party Leadership Model, was devised by Andreas Murr in the run up to the 2015 general election. It successfully anticipated David Cameron’s victory unlike the vast majority of other forecasts at the time. Murr has elaborated the model further for this election to produce a seats forecast, not just a prediction as to who will emerge as prime minister. His new model forecasts that the Conservatives will win an overall majority this week with 342 seats, and that Labour will win 254 seats.

Continue reading The Party Leadership Model predicts a Conservative overall majority

Why are polls from different pollsters so different?

By Stephen Fisher and Dan Snow.

On average the polls have had a fairly consistent and comfortable lead for the Conservatives in this general election campaign. However, around that average there are substantial differences between polls. Some suggest the Conservatives might fail to win a big enough lead to secure a majority, while others point to a Tory landslide with a majority over a hundred. What’s going on?

In short, since this is a long and complicated blog, our tentative conclusion is that the big systematic differences between pollsters are due primarily to systematic differences in the kinds of people they have in their samples, even after weighting. Some of the sample profile differences translate straightforwardly into headline differences. For instance, having more 2017 Conservatives in a sample means there will be more 2019 Conservatives. In other areas there are more puzzling findings. Polls vary in the extent to which women are more undecided than men and in the extent to which young adults are less certain to vote, but neither source of variation has the effect on headline figures that we would expect. Nonetheless for most of the aspects of the poll sample profiles we have inspected, it is remarkable the extent to which polls differ primarily between pollsters, with relatively little change over time for each pollster. This suggests that the way different pollsters have been going about collecting responses has yielded systematically different kinds of respondents for different pollsters. With a couple of exceptions, it seems as though it has been the process of data collection rather than post-hoc weighting and adjustment that may be driving pollster differences in this campaign.

As the graph below shows, a large part of the variation between polls is between pollsters. The pollsters have shown a similar pattern of change in the Conservative-Labour lead over time, most with a peak in mid-November and a slight decline since. The headline Conservative-Labour lead – the basis for the swingometer – is the main guide to seat outcomes. So an important question is why pollsters differ systematically in the size of their published Conservative leads.

ConLabLead

In this blog post we use data from the standard tables that pollsters have to publish as part of the requirements of British Polling Council membership. They contain a wealth of information about the profiles of the different survey samples both before and after weighting and adjustment. We collected data from such tables for all polls between the 30th of October (when parliament voted for an early general election) to the 4th of December (just over a week before the end of the campaign). There have been more polls since then but so far as we can tell they do not substantially change the issues we raise here.

Continue reading Why are polls from different pollsters so different?

Fifth combined forecast for the 2019 general election

By Stephen Fisher, John Kenny and Rosalind Shorrocks 

Since our update last week there have been several new forecasts, most notably including the YouGov MRP (multilevel regression and post-stratification) model. That was a nowcast rather than a forecast, but the same is true of most of our “forecasts”. More on differences between forecasting models below, along with some observations about intriguing question wording effects for citizen forecasts.

But first, overall, the seats projections overall have tightened for the Conservatives, who are down from a 353 average last week to 346 this week, while Labour are up from 209 to 218. The Liberal Democrat forecast total has dropped yet again (from 23 to 19). Now they are estimated to return fewer MPs than they had going into the election (20), but still more than the number of seats they won in 2017 (12).

Seats Betting Markets Complex models Simple models Average
Con 343 347 348 346
Lab 220 218 217 218
LD 19 18 19 19
Brexit 0 0 0
Green 1 1 1 1
SNP 45 45 44 45
PC 5 4 3 4
Con majority 36 45 46 42

Conservative Seats - 4th December

There is now remarkably little difference between the betting markets, complex and simple models in the expected size of the Conservative majority. Particularly striking is that on average the complex models differ by only a seat for each party from the simple uniform change projections based on the average of the opinion polls.

Continue reading Fifth combined forecast for the 2019 general election