Category Archives: Forecast updates

Local election seat projections for 2024

By Stephen Fisher, 1st May 2024.

Changes in vote intention opinion polls typically provide an indication of headline net seat changes at local elections. Most of the seats up this year were last fought in 2021. The following table shows how party support in the opinion polls has changed since then.

Table 1. Opinion poll changes from 2021 locals to 2024 locals

%2021 polls2024 pollsChange
Con4123-18
Lab3644+8
LD79+2
Reform312+9
Green56+1

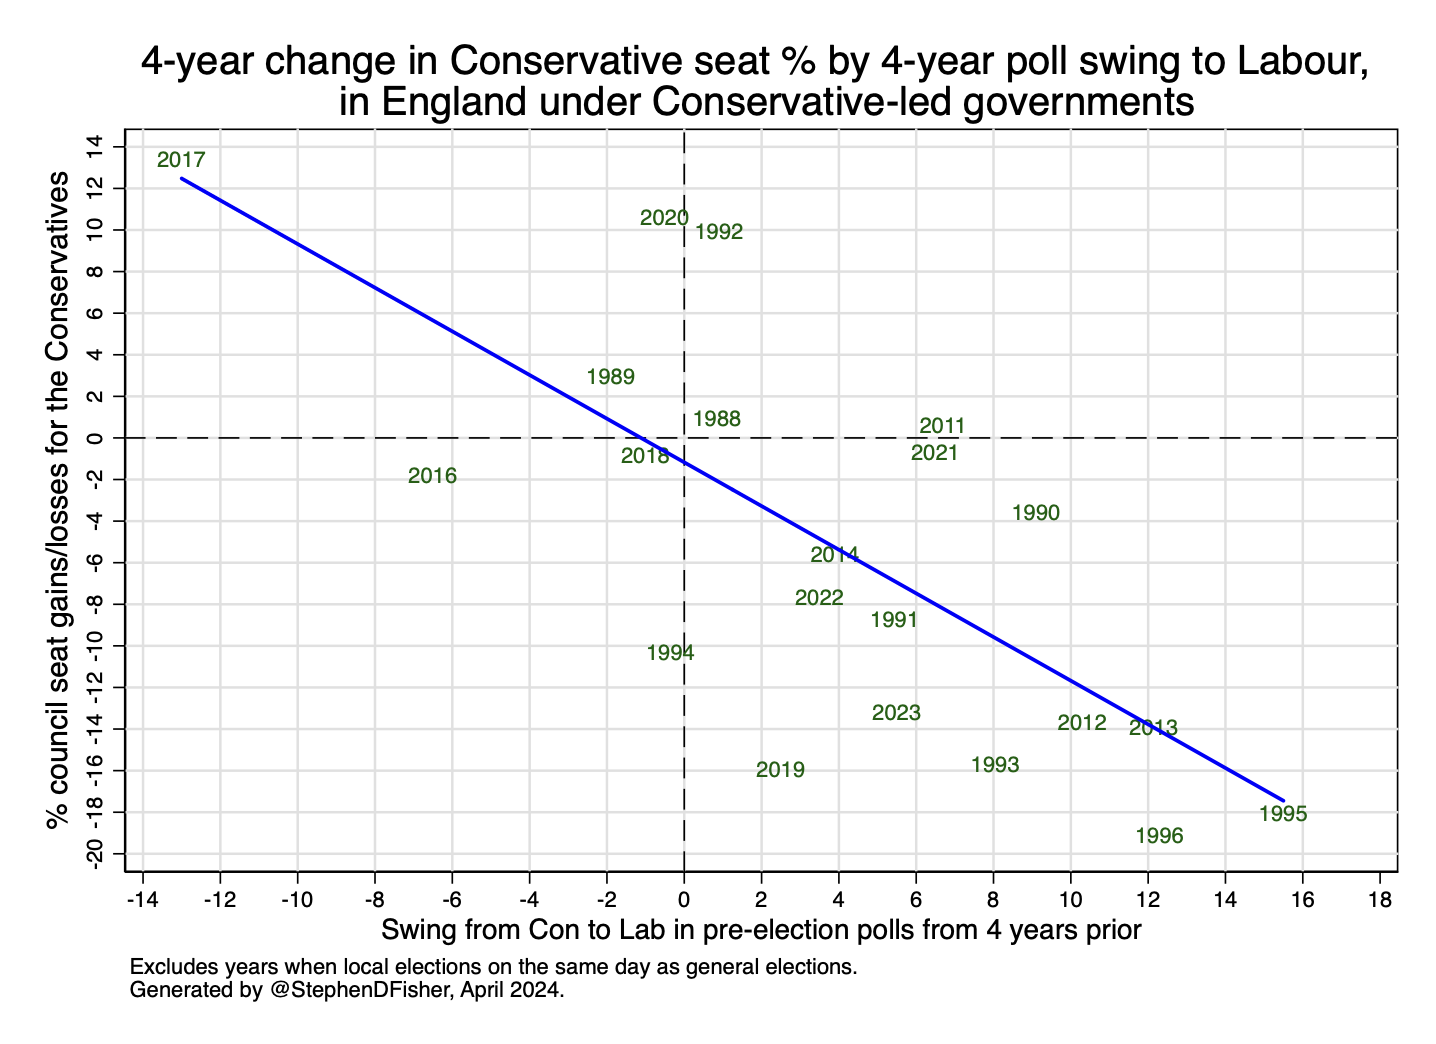
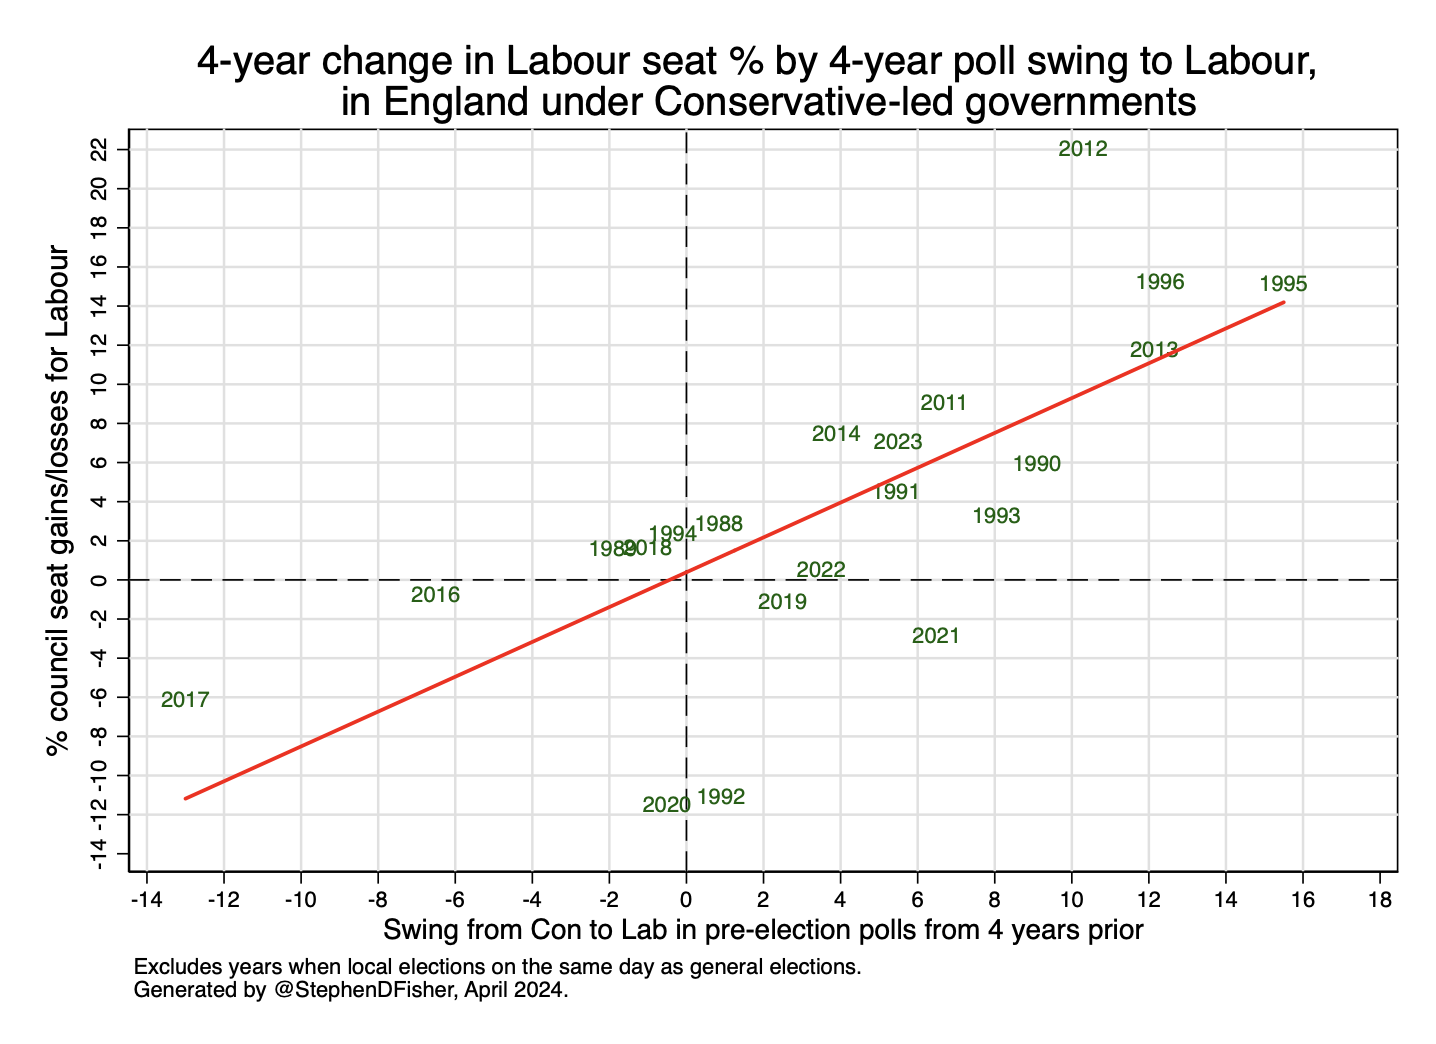
Those changes imply a 13-point swing from Conservative to Labour. The graphs below show broadly how that might translate into seat gains for Labour and losses for the Conservatives as percentages of the 2650+ seats up this year. The 13 point swing should put this week’s local election results on par with those for 1995, 1996 and 2013.

Liberal Democrat local seat tallies at the national level have historically been linked primarily on the swing between them and the Conservatives. That swing is 10-points to the Liberal Democrats this time. 

Table 2 below shows predictions from the regression models. The figure for Others is just an accounting balance. The Conservative and Labour models are based on Con-Lab swing and the Lib Dem model is based on Con-LD swing. The three are estimated separately. They do not take direct account of the rise in the Reform party share, nor perhaps more importantly given their success last year, the big rise in the number of Green party candidates relative to the number of seats up for election. 

Table 2. Model based forecasts for English local election net seat gains/losses for 2024

 Forecast
Con-390
Lab+320
LD+100
Others-30

Based on last year’s experience, I would expect the Conservatives to do worse than the model suggests, and the Liberal Democrats and Others (mainly Greens) to do better. 

Continue reading Local election seat projections for 2024

Local elections seat projections for 2023

By Stephen Fisher, 2nd May 2023.

Changes in vote intention opinion polls typically provide an indication of headline net seat changes at local elections. This year presents a significant challenge to that idea. 

Most of the seats up this year were last fought in 2019. The following table shows how party support in the opinion polls has changed since then.

Table 1. Opinion poll changes from 2019 locals to 2023 locals

%2019 polls2023 pollsChange
Con2929
Lab3344+11
LD910+1
Brexit+UKIP+Reform196-13
Green55

With little net change for the Conservatives, Liberal Democrats or Greens, there has been a big swing from the parties which Nigel Farage once led (UKIP, Brexit and Reform) to Labour. We know from surveys that is not the product of much direct switching from Farage parties to Labour. Most of the support for UKIP and the Brexit Party from the spring of 2019 went to the Conservatives by the general election that year. Labour’s more recent rise of support has come disproportionately from 2019 Conservative-Remain voters, even though in absolute terms there have been more Conservative-Leave voters switching to Labour. Also, some of the Labour rise is apparently due to the decline in the numbers of people telling pollsters they know whom they would vote for.

Before thinking about how those general election vote changes might affect local elections this time, we need to reflect on a puzzle from last time. Back in 2019, the Farage parties did not stand many candidates. Many of their supporters must have turned up to the polls but had to look elsewhere for someone to vote for. That was perhaps part of the reason why independents and candidates for micro parties did so well that year. If so, then maybe the independents will do much less well this time now the Farage parties are less popular. But those independents and others who were elected in 2019 might since have built up personal support and benefit as first-term incumbents.

If the rise of Labour in the polls is, to an unusual extent, due to the rise of “Don’t Knows”, it might not translate to gains at the local elections. At around a third of the electorate, local election voters are more engaged and partisan. The rise of the “Don’t Knows” may have been more limited among those who normally vote in local elections. If so, the swing to Labour in the local elections might be smaller than what the polls suggest. 

In addition to those unusual factors, there are the usual reasons why poll swings do not necessarily translate into local election outcomes, especially local politics and selective candidature. 

Nonetheless, I have applied my usual local election seats forecasting models regardless. If nothing else it is interesting to consider the extent to which local election results do track opinion polls, and analysis of the discrepancies is instructive.

Continue reading Local elections seat projections for 2023

Forecasting Local Election net seat gains/losses 2022

by Stephen Fisher, 3rd May 2022.

There are local elections tomorrow in England, Scotland, and Wales. Table 1 below shows my forecasts for net seat changes for each. They are based on projecting changes in opinion poll performance since the last round of local elections, with different methods for the different countries as discussed below. They represent what we might expect if the changes in party performance in local elections are on par with changes in the opinion polls.

Table 1. Forecasts for English local election net seat gains/losses for 2022

EnglandWalesScotlandOverall
Con-165-80-36-281
Lab+140+80+84+304
LD+700+6+76
PC 0 0
SNP  -24-24

The Conservatives are expected to lose seats in all three countries. They are defending a strong 2017 base in Scotland and Wales, and dropped in the polls since both 2017 and 2018 when the English seats were last fought. 

Labour are expected to be the main beneficiaries from Conservative losses. The projections suggest Labour might recover most but not all the losses they suffered in 2017 in Scotland and Wales. In England, Labour are trying this week to build on cumulative gains from 2010, 2014 and 2018. They already control over half the seats up this year. Since Labour are at 40% in the polls, their poll support is no greater than is was in 2018. Instead of gaining seats from winning more voters, Labour are projected to make council seat gains in England primarily from the drop in the Conservative vote. But, as discussed below, last-year’s experience shows there are various reasons why that might not happen. 

Perhaps most surprising of the forecasts is the projected drop in SNP seats from what was considered a disappointing performance in 2017, winning only 32% of the first-preference vote when typically the party has been winning at least 45% of the vote in Scotland-wide elections since the independence referendum in 2014. My projection for the Scottish locals this week is based on changes since 2017 in local-election first-preference vote intention polls. Even general-election vote-intention polls show no advance on 2017 for the SNP. The party will be hoping that more of the people who vote for them in Westminster and Holyrood elections will support them in the locals this week. 

England

Typically, the Conservatives lose English council seats when their lead over Labour in the opinion polls drops from what it was the last time the election was fought. Similarly, if the Tories extend their lead, then they typically make net gains. The graph below shows that pattern for local elections in England when the Conservatives were in government and the local elections were not on the same day as a general election. There is a strong correlation, but with a lot of noise around it, meaning any forecast comes with a big range of uncertainty. This year either of the two main parties could be either up or down by more than 100 seats based on the variation in previous local elections.

Last year’s local elections contributed to that noise. The graph above distinguishes between what happened in the elections that were delayed from 2020 because of the Covid pandemic, and those that happened in 2021 as scheduled. The Conservatives substantially outperformed expectations from the historical pattern for both sets of elections. They made +248 gains in the “2020” set despite polls (in 2021) showing only a 1-point increase in the Con-Lab lead since 2016. For the 2021 set, the Tories suffered a net loss of only 14 seats despite the poll lead dropping by 13 points from the high that Theresa May enjoyed in the 2017 local elections (before losing most of it at the general election the following month).

Continue reading Forecasting Local Election net seat gains/losses 2022

What do citizens forecast for the 2021 German federal election?

Guest post by Andreas Murr, University of Warwick.

On Sunday 26 September Germans will go to the ballot box to cast several votes in state and federal elections.  The Economist and several academics have published their federal election forecasts.   But who do Germans think will win the election?  Two research teams have used such citizen forecasts to predict the upcoming federal election.

Murr and Lewis-Beck predict the parties’ national vote shares based on citizens’ responses to the question “Who will win the general election?”  Their prediction is based on a regression model of historical vote shares on citizen forecasts and whether there was a grand coalition.  The historical data goes back until 1980.  Combing their regression model with a recent Politbarometer survey from June, they predict CDU/CSU to win 34% of the vote and SPD to win 21%. of the vote.  According to them, a CDU/CSU/SPD coalition seems the safest bet statistically, though a CDU/CSU-Greens coalition is not out of the question.

Kayser et al. predict both constituency winners and parties’ national vote shares by simply aggregating citizen forecasts collected in a survey the last two weeks.  They collected two different kinds of citizen forecasts.  First, they asked citizens to forecast which candidate will win in their constituency.  And, second, they asked citizens what vote share each party will win nationally.  The authors then simply predict the constituency to be won by the candidate who most citizens say will win.  And, they predict the vote share of a party to be the average of citizens’ forecasted vote share.  In other words, only survey data and no historical data was used to forecast the election.  Citizens collectively predict that CDU/CSU will win more constituencies than the SPD (174 v. 98).  However, they also collectively predict that SPD will win a higher national vote share than CDU/CSU (25% v. 23%).  The Greens are predicted to win 16%.

Why do the forecasts of the two teams differ?  The two teams use different methods and forecast with different lead times.  However, we can update the forecast of Murr and Lewis-Beck by using the most recent Politbarometer survey from mid-September.  This way the forecasts differ only in method.  If we do this, then both forecasts go in the same direction.  The Murr and Lewis-Beck model then predicts CDU/CSU to win 25% and SPD to win 31%.  In other words, their updated model would also predict the SPD to win a majority of the votes, though a bigger one than predicted by Kayser et al.  This said, Murr and Lewis-Beck did some analysis of the optimal lead time of their model: they find that it forecasts more accurately with a lead time of two months (June) than one month (September) on average.  Of course, soon we will know which lead time or method forecasted better in this election.

Forecasting Local Election Net Seat Gains/Losses 2021

by Stephen Fisher, 6th May 2021.

Local election seat gains and losses are hideous to try to predict at the best of times. Various factors make this year especially hard. The Covid-19 pandemic means that the 2020 round of local elections was postponed to today, and there have been various boundary changes and restructuring that mean it is hard to allocate many seats to either the 2016-2020 or the 2017-2021 4-year cycle that my model requires. Nonetheless, and despite the weaknesses of my 2019 forecast (discussed below), I have ploughed on regardless. This is not due to the kind of stoic determination that the Finns call sisu: amusingly summarised by someone as, “chin down and press on to the next disappointment.” Rather, I am still curious as to how much of a guide (on a broad macro level) Westminster vote intention polls are to local election outcomes. 

Headline forecasts are in the table below together with the range of possible outcomes in the model. The table includes the projections from Michael Thrasher’s second scenario here. He and Colin Rallings would normally calculate an expected National Equivalent Vote (NEV) from the results of local by-elections, but those have not been happening. Instead Michael Thrasher has used adjusted opinion polls to estimate the NEV and then projected the implied changes at the ward/division level. Both mine and his methods use polls this year, but whereas Michael’s is a local projection based on previous ward and division level results, mine is based on regression models of the macro historical relationship between poll changes and net seat changes. (For a really micro, individual-level approach, predicting Labour losses in “red-wall” councils, but not overall net gains and losses, see the analysis from YouGov’s Patrick English here.)

Table 1. Forecasts for English local election net seat changes 2021

ForecastRangeThrasher
Con-210-770 to +350+120
Lab+70-290 to +430-50
LD+140-50 to +330-70
Others0 0

It is striking that my forecasts point in different directions from Michael Thrasher’s projections for every party. But with 4630 odd seats up for election, both sets of predictions are for modest net changes. The prediction intervals for my forecasts comfortably include zero for all three parties, so each of them could easily end either up or down when all the results are in. 

Continue reading Forecasting Local Election Net Seat Gains/Losses 2021

Final combined forecast for the 2019 general election

By Stephen Fisher, John Kenny and Rosalind Shorrocks

Since our first combined forecast at the start of the campaign, the number of forecasts for this general election has grown substantially. All of the combined forecasts – seats, vote shares, and probabilities – are pointing to a Conservative majority. However, some individual forecasts do predict a hung parliament, and there is variation within each forecast type over how certain this majority is, and how large it is predicted to be.

SEATS

Seat projections from the betting markets, complex models, and simple models are all very similar, forecasting a Conservative majority of between 343 and 351 seats. The average number of seats across all forecasts that the Conservatives are expected to win – 341 – is slightly lower but ultimately very similar to the forecast last week.

Since last week the Political Studies Association have published their Expert Survey, in which the average expected number of Conservative seats suggests a hung parliament with the Conservatives just shy of a majority. It is interesting that the experts surveyed by the PSA predict the Conservatives will win fewer seats than is currently suggested by the polls. Perhaps they are factoring in the same kind of late-campaign changes as observed in 2017 – although it should be noted that when a similar kind of survey was run for the EU referendum in 2016, the average predicted vote share for Remain and Leave amongst experts was the furthest away from the actual result than any of the other types of forecast. They also predicted a Conservative majority in 2017, although that prediction was made much more earlier in the campaign when the Conservatives had considerable leads over Labour in the polls.

Seats Betting Markets Complex models Simple models Experts Average
Con 346 343 350 324 341
Lab 221 225 219 233 224
LD 18 17 18 25 19
Brexit 0 0 0 2 1
Green 1 1 1 2 1
SNP 43 44 41 42 43
PC 4 3 3 4 4
Con majority 42 37 49 -2 31


Conservative Seats - 11th December

The similarity between the seat projections from most sources hides considerable variation within one particular forecast type – complex models. These models range from predicting 311 Conservative seats to 366 – the difference between a hung parliament and a healthy Conservative majority. They also range between 190 and 268 for Labour. It is particularly noteworthy that the voter expectation model, from Murr, Stegmaier, and Lewis-Beck, which uses citizen forecasts to predict the number of seats, forecasts one of the highest number of Conservative seats (360) and the lowest number of Labour seats (190). This is in contrast to our implied probability calculated from the citizen forecasts, which suggest that citizens are in general the least convinced about the likelihood of a Conservative majority compared to other forecasting methods. This suggests these surveys also suffer from being open to multiple interpretations and methods of analysis, as well as the question wording effects we discussed last week.

Continue reading Final combined forecast for the 2019 general election

The 2018 and 2019 local election results suggested the Conservatives might struggle to get a majority at the next general election

By Chris Prosser and Stephen Fisher.

Every May local election results are analysed as indicators of the state of the political parties and scrutinised for what they tell might tell us about the outcome of the next general election. That general election is tomorrow. Although a lot has happened in politics since May 2019, and especially since May 2018, it might be worthwhile reminding ourselves of what happened in the local elections then and what those results portend for the outcome this week.

In 2015, when the polls failed to anticipate a Conservative majority, one of the more successful forecasting models was Chris Prosser’s one based on the 2013 and 2014 rounds of local elections. Unlike the polls – which showed the Conservatives and Labour neck and neck – that model forecast a four point Conservative lead in vote share. Using a uniform change projection, the forecast shares predicted a Conservative tally of 296 seats for 2015, short of an overall majority but better than a uniform projection from the final opinion polls and the best of a set of twelve academic forecasting models for that election.

Applying the same method again, the table below shows that both the 2018 and 2019 rounds of local elections point to a clear lead for the Conservatives in a subsequent general election. However, the forecast shares of the vote from both rounds do not suggest a big enough lead for the Conservatives to be sure of an overall majority. On the average of the two set of vote shares, coupled with a uniform change projection (also using last night’s YouGov MrP projected SNP and PC vote shares) points to a very narrow Conservative majority of 8.

Party Forecast share based on 2018 results Forecast share based on 2019 results Average forecast share Standard Error of share forecast Seats forecast
Con 40.8 36 38.4 4 329
Lab 33.8 29 31.4 4 231
LD 13.4 15.4 14.4 4 23
Other 12 19.6 15.8 4 65

The fact that a forecast based on local elections 7 and 19 months ago should be so close to last night’s YouGov MrP projection of Con 339, Lab 231, LD 15 is remarkable. There is just a difference of 10 seats for the Tories and none for Labour.

Given that since the 2018 local elections we’ve had May’s Deal and the first missed Brexit deadline, and since the 2019 local elections we’ve seen Brexit Party and Lib Dem success in the European parliament elections, a new prime minister, a new Brexit withdrawal agreement, and another missed Brexit deadline, it is even more surprising that most opinion polls now do not differ profoundly from what previous local elections suggested would happen.

The Party Leadership Model predicts a Conservative overall majority

By Andreas Murr and Stephen Fisher.

Two years ago Andrew Adonis wrote a piece in Prospect arguing that Labour should ditch Jeremy Corbyn because of the importance of party leadership for electoral success. The piece claimed that “the best leader wins and nothing else matters,” and in Lord Adonis’s view Mr Corbyn is the worst Labour leader since Michael Foot. So, Adonis concluded already in September 2017, that regarding the next election “Corbyn will lose it decisively if he contests it.”

In response to Adonis’ claims many, including Danny Finkelstein, expressed skepticism about the power of leadership and pointed out that it is difficult to properly evaluate the quality of leaders in retrospect. Once we know who won and who lost we have a tendency to convince ourselves that the winner was a better leader than the loser. But there are ways of producing measures of leadership quality prior to elections which have historically been useful for forecasting election outcome.

The Party Leadership Model, was devised by Andreas Murr in the run up to the 2015 general election. It successfully anticipated David Cameron’s victory unlike the vast majority of other forecasts at the time. Murr has elaborated the model further for this election to produce a seats forecast, not just a prediction as to who will emerge as prime minister. His new model forecasts that the Conservatives will win an overall majority this week with 342 seats, and that Labour will win 254 seats.

Continue reading The Party Leadership Model predicts a Conservative overall majority

Fifth combined forecast for the 2019 general election

By Stephen Fisher, John Kenny and Rosalind Shorrocks 

Since our update last week there have been several new forecasts, most notably including the YouGov MRP (multilevel regression and post-stratification) model. That was a nowcast rather than a forecast, but the same is true of most of our “forecasts”. More on differences between forecasting models below, along with some observations about intriguing question wording effects for citizen forecasts.

But first, overall, the seats projections overall have tightened for the Conservatives, who are down from a 353 average last week to 346 this week, while Labour are up from 209 to 218. The Liberal Democrat forecast total has dropped yet again (from 23 to 19). Now they are estimated to return fewer MPs than they had going into the election (20), but still more than the number of seats they won in 2017 (12).

Seats Betting Markets Complex models Simple models Average
Con 343 347 348 346
Lab 220 218 217 218
LD 19 18 19 19
Brexit 0 0 0
Green 1 1 1 1
SNP 45 45 44 45
PC 5 4 3 4
Con majority 36 45 46 42

Conservative Seats - 4th December

There is now remarkably little difference between the betting markets, complex and simple models in the expected size of the Conservative majority. Particularly striking is that on average the complex models differ by only a seat for each party from the simple uniform change projections based on the average of the opinion polls.

Continue reading Fifth combined forecast for the 2019 general election

Fourth combined forecast for the 2019 general election

By Stephen Fisher, John Kenny and Rosalind Shorrocks 

There has not been much change in our combined forecast over the last week. The Conservatives are still apparently headed towards a comfortable majority (55 on average) based on an average forecast vote share lead over Labour of 12 points. The average predicted probability of a Tory majority has crept up to 72%, partly due to increasing confidence in the betting markets and the quantitative forecasting models, as well as the polls. Citizens remain much more sceptical. Concerns that the Liberal Democrats might make little advance continue, and were compounded by the Datapraxis MrP forecast of just 14 seats for the party. Otherwise the Datapraxis forecast was largely in line with other forecasts of headline seats totals. Further MrP based forecasts are due this week, including YouGov’s.

Seats Betting Markets Complex models Simple models Average
Con 346 353 360 353
Lab 210 212 204 209
LD 25 21 22 23
Brexit 0 0 0
Green 1 1 1 1
SNP 45 45 43 44
PC 4 4 4 4
Con majority 42 55 69 55

Conservative Seats - 27th November   Continue reading Fourth combined forecast for the 2019 general election