Local elections 2024 summary (Saturday 4th May)

What we know at 8.20pm on Saturday 4th May 2024, after 106 out of 107 councils, 2640 councillors, 11 Mayoralties (including London and estimated West Midlands result), 35 out of 37 Police and Crime Commissioners (PCC), the Greater London Assembly (with all votes declared but not the D’Hondt allocation), and 1 parliamentary by-election. Just 1 council and 2 PCCs to declare.

Verdict: 

Extremely bad for the Conservatives. Good for Labour and Lib Dems. Very good for Greens. Mixed for Reform UK.

Conservatives:

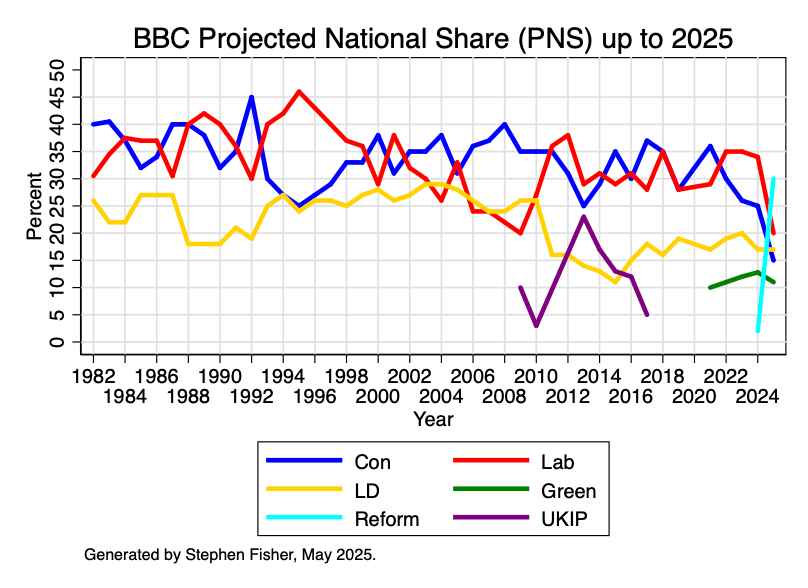
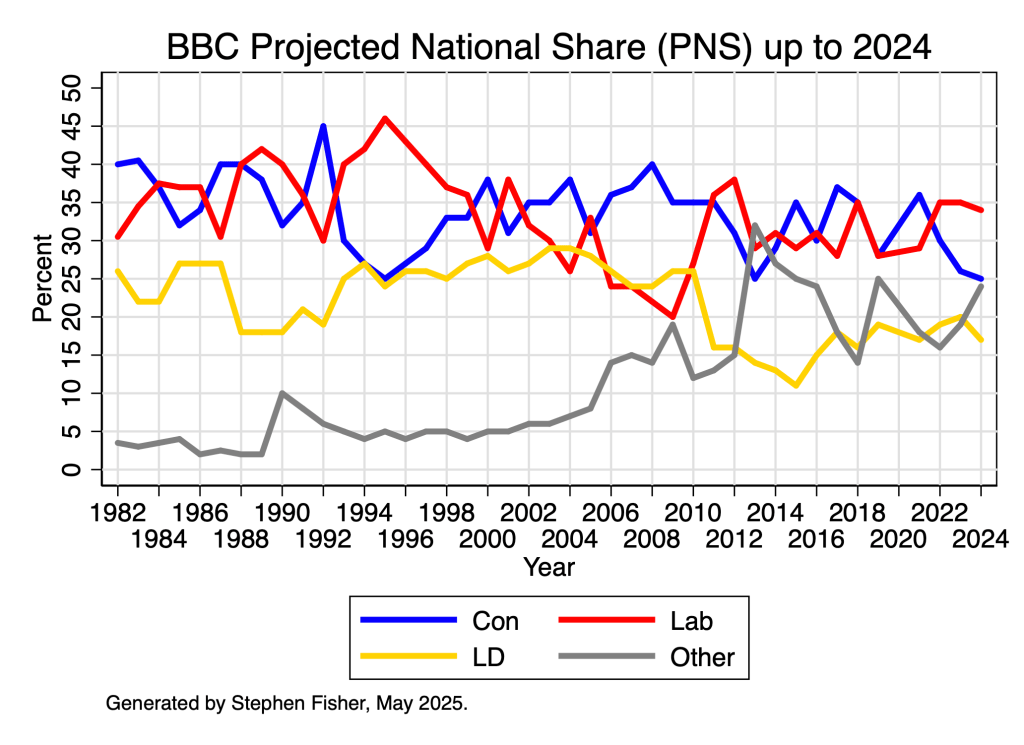
  • Dropped to 25% in the BBC Projected National Share (PNS) of the local election vote: their joint lowest since records began in 1982
  • Lost control of 10 councils out of 16 they were defending: Adur, Basildon, Dorset, Dudley, Gloucester, Havant, North East Lincolnshire, Nuneaton & Bedworth, Redditch and Rushmoor.
  • – 473 net council seat losses: 48% of the 986 they defended, leaving them behind the Liberal Democrats in total seats won.
  • Won only 1 of the 11 directly elected Mayoralties, with Andy Street narrowly losing the West Midlands and Ben Houchen suffering a 17-point swing to Labour in Tees Valley.
  • Lost 10 of the 27 Police and Crime Commissioners they defended, with an average drop in vote share of 8 points across the 27.
  • Lost the contest for London Mayor with a 3-point drop in their share of the vote.
  • Lost 1 seat in the Greater London Assembly after a 3-point drop in their London-wide list vote.
  • Lost the Blackpool South by-election on a 26% swing (the third biggest by-election swing in the post-war period).

Labour:

  • First place with 34% in the BBC Projected National Share (PNS) of the local election vote: down 1 point on last year, but another 9-point lead over the Conservatives. Not as good as Labour achieved before their 1997 victory, but better than at any set of local elections where they went on to lose the general election.
  • +8 net gains in council control. Gained 10 (Adur, Cannock Chase, Hartlepool, Hyndburn, Milton Keynes, Nuneaton & Bedworth, Redditch, Rushmoor, Tamworth and Thurrock), but lost Kirklees and Oldham. Retained control of a further 40 councils.
  • +185 net council seats gains
  • Won 10 of the 11 directly elected mayor positions, including West Midlands from Andy Street and London, that is all but Tees Valley which Labour failed to take despite achieving a 17-point swing there.  
  • +10 gains of Police and Crime Commissioners, and held all 10 of those they were defending. Average vote share increase of +8 points across all 35 contests.
  • Won the London Mayor contest for the third time in a row, with an increased vote share of +4-points.
  • Maintained their position as largest party in the Greater London Assembly with 11 out of the 25 seats.
  • Won the Blackpool South by-election on a 26% swing (the third biggest by-election swing in post-war period), in line with other big by-election wins for Labour this parliament.

Liberal Democrats:

  • Gained control of Dorset and Tunbridge Wells and held all 10 councils they were defending.
  • +104 net council seat gains, winning 521 seats in total (more than the 513 secured by the Conservatives). 
  • Increased vote share +3 points on average across the Police and Crime Commissioners, despite the change in the electoral system creating incentives for their supporters to vote tactically away from them in most places.
  • Maintained their position in the Greater London Assembly with 2 seats.

Green Party:

  • Secured their best local elections performance ever (better than 2019): enough to put them at 13% in the local elections Projected National Share (PNS)
  • +74 net council seat gains, winning 181 seats in total 
  • Averaged 15% across the 7 Police and Crime Commissioner positions they stood for, despite the change in the electoral system creating incentives for their supporters to vote tactically for others
  • Maintained their position in the Greater London Assembly with 3 seats.

Reform UK:

  • Came 3rd on 17%, narrowly behind the Conservatives, at the Blackpool South by-election.
  • Won just 2 council seats out of 2640 up for election.
  • Averaged 12% of the vote, in the wards they contested, but they contested just 12% of seats.
  • Put in a much more limited effort and much less impressive performance than UKIP did in local elections between 2013 and 2016.
  • 1 seat on the Greater London Assembly with 6% of the vote.

See analysis by John Curtice and the rest of the BBC team for further detail.

Local election results summary (8pm Friday 8th May 2024)

by Stephen Fisher

What we know at 8pm on Friday 3rd May 2024, after 1 by-election, 98 out of 107 councils, 2199 councillors, 4 Mayoralties, and 27 out of 37 Police and Crime Commissioners declared so far.

Bad for the Conservatives. Good for Labour and Lib Dems. Very good for Greens. Mixed for Reform UK.

Conservatives:

  • Lost the Blackpool South by-election on a 26% swing (the third biggest by-election swing largest in post-war period).
  • Lost control of 8 councils net (Adur, Basildon, Dudley, Havant, North East Lincolnshire, Nuneaton & Bedworth, Redditch and Rushmoor), out of 13 defended
  • Lost 424 council seats net, out of 877 defended and declared so far
  • Won only 1 of the 4 directly elected Mayoralties declared so far
  • Lost 9 of the 21 Police and Crime Commissioners defended and declared so far, with an average drop in vote share of 9 points

Labour:

  • Won the Blackpool South by-election on a 26% swing (the third biggest by-election swing largest in post-war period).
  • Gained control of 8 councils net (gains were Adur, Cannock Chase, Hartlepool, Hyndburn, Milton Keynes, Nuneaton & Bedworth, Redditch, Rushmoor, Tamworth and Thurrock, but lost Kirklees and Oldham)
  • Gained 169 council seats net 
  • Won 3 of the 4 Mayoralties
  • Gained 9 Police and Crime Commissioners and held all 5 of those they were defending, with an average vote share increase of +8 points

Liberal Democrats:

  • Gained control of Tunbridge Wells and held all 10 councils they were defending
  • Gained 79 council seats net 
  • Increased vote share +5 points on average across the Police and Crime Commissioners declared so far

Green Party:

  • Gained 60 council seats net
  • Increased vote share, averaging 13 points where they stood, despite also contesting more seats than before. 
  • Averaged 8% in the 3 PCCs they contested that have declared so far

Reform UK Party:

  • Came 3rd on 17%, narrowly behind the Conservatives, at the Blackpool South by-election
  • Won just 2 council seats out of 2160 declared so far.
  • Averaged 12% of the vote, in the wards they contested. That is up 6 points on last year, but they contested just 12% of seats.
  • Put in a much more limited effort and less good performance than UKIP in local elections before 2015.

See analysis by John Curtice and the rest of the BBC team for further detail.

Local elections 2024 so far (at 7am Friday 3rd May)

What we know so far, after 1 by-election, 35 out of 107 councils, and 3 Police and Crime Commissioners declared.

Bad for the Conservatives. Good for Labour, Lib Dems, Greens, and Reform UK.

Conservatives have:

  • Lost the Blackpool South by-election on a 26% swing (the third biggest by-election swing largest in post-war period).
  • Lost control of 3 councils (North East Lincolnshire, Redditch and Rushmore), out of 6 defended and declared so far
  • Lost 122 council seats net, out of 267 defended and declared so far
  • Lost 2 of the 3 Police and Crime Commissioners defended and declared so far, with an average drop in vote share of 12 points.

Labour have:

  • Won the Blackpool South by-election on a 26% swing (the third biggest by-election swing largest in post-war period).
  • Gained control of 3 councils net (gains were Hartlepool, Redditch, Rushmoor, and Thurrock, but lost Oldham)
  • Gained 52 council seats net 
  • Gained 2 of the 3 Police and Crime Commissioners declared so far, with an average increase in vote share of 11 points.

Liberal Democrats have:

  • Held 3 councils so far declared than they were defending.
  • Gained 18 council seats net 
  • Increased vote share +3 points on average across the 3 Police and Crime Commissioners declared so far.

Green Party have:

  • Gained 13 council seats net
  • Vote share up on average in BBC keywards
  • Increased vote share +5 points and moved into 3rd place in the only Police and Crime Commissioners declared so far they contested.

Reform Party have:

  • Come 3rd on 17%, narrowly behind the Conservatives, at the Blackpool South by-election
  • Vote share up on average in BBC keywards
  • Increased vote share by 11 points in the only Police and Crime Commissioner they contested that has declared so far.

Understanding the Local Elections Projected National Share (PNS) in 2024

by John Curtice and Stephen Fisher, 1st May 2024.

Seats won and lost in the local council elections in England this week may be a poor guide as to how well the parties performed. Since the elections are held under single or multi-member plurality, without any increase in support a party may make big gains in seats off the back of another party losing votes. A third party whose vote is geographically spread may make a substantial advance in votes yet reap little reward in terms of seats. Meanwhile, seats won and lost only provide an indication of whether a party has lost or gained ground as compared with when the seats up for grabs were last contested.

These caveats are important again this year. Around 70% of the council seats up for grabs this year were last fought over in May 2021. Boris Johnson was Prime Minister and the Conservatives were successfully claiming the credit for an early Covid vaccine rollout. The party enjoyed a six-point lead in the polls, gained over 200 seats in the local elections and recorded their best performance in terms of votes since 2017.

The Conservatives therefore face the challenge this week of defending a strong baseline while running 20 points behind in the polls (an even weaker position than this time last year). They look set to make significant losses. Other parties, such as the Liberal Democrats, may gain seats purely as a result of the decline in support for the Conservatives, without necessarily attracting more voters themselves.

That said, one key uncertainty is that Reform UK are only fielding candidates in one in six of the wards where local elections will take place. According to the polls, the Conservatives are now losing more of their 2019 voters to Reform than any other party. Perhaps some of these voters will switch to the Conservatives where Reform are not on the ballot paper, thereby helping to stem Conservative losses. 

Yet we cannot assess party performance by simply adding up the votes cast (even if we had the resource to collect them all on election night). In England (unlike Scotland and Wales) it is never the case that the whole country votes in local elections at the same time. The places that vote one year are politically different from those that vote in another.

Continue reading Understanding the Local Elections Projected National Share (PNS) in 2024

Local election seat projections for 2024

By Stephen Fisher, 1st May 2024.

Changes in vote intention opinion polls typically provide an indication of headline net seat changes at local elections. Most of the seats up this year were last fought in 2021. The following table shows how party support in the opinion polls has changed since then.

Table 1. Opinion poll changes from 2021 locals to 2024 locals

%2021 polls2024 pollsChange
Con4123-18
Lab3644+8
LD79+2
Reform312+9
Green56+1

Those changes imply a 13-point swing from Conservative to Labour. The graphs below show broadly how that might translate into seat gains for Labour and losses for the Conservatives as percentages of the 2650+ seats up this year. The 13 point swing should put this week’s local election results on par with those for 1995, 1996 and 2013.

Liberal Democrat local seat tallies at the national level have historically been linked primarily on the swing between them and the Conservatives. That swing is 10-points to the Liberal Democrats this time. 

Table 2 below shows predictions from the regression models. The figure for Others is just an accounting balance. The Conservative and Labour models are based on Con-Lab swing and the Lib Dem model is based on Con-LD swing. The three are estimated separately. They do not take direct account of the rise in the Reform party share, nor perhaps more importantly given their success last year, the big rise in the number of Green party candidates relative to the number of seats up for election. 

Table 2. Model based forecasts for English local election net seat gains/losses for 2024

 Forecast
Con-390
Lab+320
LD+100
Others-30

Based on last year’s experience, I would expect the Conservatives to do worse than the model suggests, and the Liberal Democrats and Others (mainly Greens) to do better. 

Continue reading Local election seat projections for 2024

Understanding the Local Elections Projected National Share (PNS) in 2023

by John Curtice and Stephen Fisher, 3rd May 2023.

Much of the speculation about what might happen in the English local elections this week has focused on how many seats each party could or should gain or lose. The Conservatives have seemingly accepted an analysis for the Local Government Chronicle that they could lose 1,000 seats – presumably in the hope that they will do better than that – while Labour have suggested they might win 400 – presumably anticipating they will gain rather more. We can expect many a judgement to be cast on Friday on the basis of this evidence. 

However, given that these elections are held under single or multi-member plurality, seats won and lost can be a poor guide to how well a party has done in the ballot box. A party whose vote has fallen less than that of their principal rivals may gain seats even though it has lost votes. A third party whose vote is geographically spread may make a substantial advance in votes yet reap little reward in terms of seats. Meanwhile, seats won and lost only provide an indication of whether a party has lost or gained ground as compared with when the seats up for grabs were last contested.

These caveats are particularly important this year. Ninety per cent of the seats were last fought in May 2019, when Theresa May was Prime Minister and Jeremy Corbyn Leader of the Opposition, both of whom were rebuffed by voters in the local ballot boxes. In contrast, the Liberal Democrats and the Greens performed relatively well four years ago. Meanwhile, just over 5,000 of the 8,000 seats at stake are in relatively small shire district councils, where in most instances all of the seats are up for grabs in wards that elect more than one councillor at the same time. The outcome in these districts will dominate the headline numbers. Moreover, in many instances they are places where Labour is not competitive locally, and the scale of any Conservative losses will depend not on how well Labour do but, rather, on the performance of the Liberal Democrats.

Yet we cannot assess the party’s votes by simply adding up the votes cast (even if we had the resource to collect them all on election night). In England (unlike Scotland and Wales) it is never the case that the whole country votes in local elections at the same time. The places that vote one year are politically different from those that vote in another. For example, unlike last year, there are no elections in Labour-dominated London.

Given all these limitations, a key indicator of party performance that has come to be part of the ritual of local election night (or the following day) is the calculation of a ‘projected national share’ (PNS). This is an estimate of the share of the vote that the principal parties would have won if, across Britain as a whole, voters had behaved in the same way as those who did vote in the wards that were contested by all three principal parties in this year’s English local elections. It provides a single, seemingly straightforward measure of party performance that can tell us not only how well or badly a party has done as compared with four years ago, but also as compared with local elections over the last forty years – even though the places in which local elections are held varies considerably from one year to the next.

Yet almost inevitably answering such a ‘what if’ question is not as straightforward as it might seem. Given the large number of wards being contested, the calculation of the PNS has to be made on the basis of a sub-sample of the local contests. None of the parties fight all of the wards being contested, and some may well fight fewer wards than others. At the same time, local election results in England tell us nothing about the performance of the nationalist parties in Scotland and in Wales. Any estimate of the PNS is affected by the decisions that are made about how best to address these issues.

Continue reading Understanding the Local Elections Projected National Share (PNS) in 2023

Local elections seat projections for 2023

By Stephen Fisher, 2nd May 2023.

Changes in vote intention opinion polls typically provide an indication of headline net seat changes at local elections. This year presents a significant challenge to that idea. 

Most of the seats up this year were last fought in 2019. The following table shows how party support in the opinion polls has changed since then.

Table 1. Opinion poll changes from 2019 locals to 2023 locals

%2019 polls2023 pollsChange
Con2929
Lab3344+11
LD910+1
Brexit+UKIP+Reform196-13
Green55

With little net change for the Conservatives, Liberal Democrats or Greens, there has been a big swing from the parties which Nigel Farage once led (UKIP, Brexit and Reform) to Labour. We know from surveys that is not the product of much direct switching from Farage parties to Labour. Most of the support for UKIP and the Brexit Party from the spring of 2019 went to the Conservatives by the general election that year. Labour’s more recent rise of support has come disproportionately from 2019 Conservative-Remain voters, even though in absolute terms there have been more Conservative-Leave voters switching to Labour. Also, some of the Labour rise is apparently due to the decline in the numbers of people telling pollsters they know whom they would vote for.

Before thinking about how those general election vote changes might affect local elections this time, we need to reflect on a puzzle from last time. Back in 2019, the Farage parties did not stand many candidates. Many of their supporters must have turned up to the polls but had to look elsewhere for someone to vote for. That was perhaps part of the reason why independents and candidates for micro parties did so well that year. If so, then maybe the independents will do much less well this time now the Farage parties are less popular. But those independents and others who were elected in 2019 might since have built up personal support and benefit as first-term incumbents.

If the rise of Labour in the polls is, to an unusual extent, due to the rise of “Don’t Knows”, it might not translate to gains at the local elections. At around a third of the electorate, local election voters are more engaged and partisan. The rise of the “Don’t Knows” may have been more limited among those who normally vote in local elections. If so, the swing to Labour in the local elections might be smaller than what the polls suggest. 

In addition to those unusual factors, there are the usual reasons why poll swings do not necessarily translate into local election outcomes, especially local politics and selective candidature. 

Nonetheless, I have applied my usual local election seats forecasting models regardless. If nothing else it is interesting to consider the extent to which local election results do track opinion polls, and analysis of the discrepancies is instructive.

Continue reading Local elections seat projections for 2023

Why governments lose: UK elections since 1922

By Stephen Fisher, 12th April 2023.

Governments in the UK tend to win elections, but lose if there is an economic crisis. That pattern explains the outcomes of 19 out of the 27 elections since 1922. A further three elections can be accounted for by governments averting electoral disaster by changing prime minister after a crisis. The combination of economic crises and political changes at the top can explain 22 of the 27 elections, including all the elections since 1987.

That is the main conclusion from my recent working paper. A simplified version of the key table from the paper is shown below. The first row shows that governments won 10 of the 13 elections that were not preceded by an economic crisis. Governments tend to win these elections because governments have a lot of power in Britain. The three elections that were lost without a crisis were all extraordinarily early elections that should not have happened. The 1923 and 1951 elections were gambles, needlessly called by a majority government. To make things worse, on both occasions the government was offering an unpalatable economic policy (tariffs and rationing respectively). The third, 1924, only happened because 1923 produced a seriously hung parliament. None of the three are serious challenges to the idea that governments ordinarily win elections.

 Post-Crisis Political Change of PMGovernment wonGovernment lostTotal
No economic crisisNo10 (1935, 1955, 1966, Oct 1974, 1987, 2001, 2005, 2015, 2017, 2019)3 (1923, 1924, 1951) 13
Economic crisis since the last electionNo2 (1950, 1983)9 (1929, 1931, 1945, 1964, 1970, Feb 1974, 1979, 1997, 2010)11
 Yes3 (1922, 1959, 1992)03
Total 151227 
Table: Economic crises, post-crisis political changes of PM and government electoral fortunes

The bottom two rows of the table show what happened after economic crises. For pragmatic reasons, economic crises are identified by recessions and devaluations from fixed exchange rate systems (such as Wilson’s 1967 devaluation and the 1992 ERM crisis). Unemployment, inflation, strikes and other economic problems still matter, but recessions and devaluations are used because they are indicative of broader crises. 

Out of the 14 post crisis elections, the government lost 9. Using polls, and by-elections before there were polls, the paper sets out how, in each of the 9 cases, the economic crisis contributed to the eventual electoral defeat of the government.   

Continue reading Why governments lose: UK elections since 1922

Local elections Projected National Share (PNS) of the vote 2022

By Stephen Fisher, 6th May 2022.

The BBC Projected National Share (PNS) of the local election vote 2022 is Con 30, Lab 35, LD 19, Others 16.

There is an explainer of the methodology at https://electionsetc.com/2022/05/04/understanding-the-local-elections-projected-national-share-pns-in-2022/.

Historically, party performance in local elections has followed a similar pattern of change over time to the general-election vote-intention opinion polls, as shown the graph below.

Changes in the PNS this year are broadly in line with changes in the polls relative to both 2018 and 2021. The Conservatives are down 7 in the polls since both 2018 and 2021, and down 5 and 6 points respectively in the PNS. Labour are at the same level in the polls and PNS as they were in 2018, but up 4 points in the polls and 6 points in the PNS since 2021. 

In both the polls and the PNS the two parties were tied in 2018. After Boris Johnson became PM the Conservatives achieved a lead that won them the 2019 general election and lasted through to 2021. Following partygate and various other controversies, that lead has been reversed. This week’s local elections essentially confirmed the message from the polls that Labour are now ahead.

In recent years the Liberal Democrats have revived their tendency to do much better in local elections than they do in general election vote intention polls. That pattern was established in the 1980s with the Liberal Alliance, but ended after the Lib Dems joined the coalition in 2010. This year the party continued its post-coalition revival. They are up 2 or 3 points relative to both 2018 and 2021, in both the PNS and the polls.

Its not such a consistent pattern with respect to other baselines.

Indications from the local elections for the next general election?

The Projected House of Commons’ seats from the PNS (with changes from the 2019 general election) is

Con 253 (-112)

Lab 291 (+88)

LD 31 (+20)

Others 75 (+4)

The Projected House of Commons takes into account differences in local and general election voting on recent occasions when the two kinds of election have been on the same day.

Continue reading Local elections Projected National Share (PNS) of the vote 2022

Understanding the Local Elections Projected National Share (PNS) in 2022

by John Curtice and Stephen Fisher, 4th May 2022.

Much of the speculation about what might happen in the English local elections tomorrow has focused on how many seats each party could or should gain or lose. Indeed, we can expect many a judgement to be cast on Friday on the basis of this evidence. However, given that these elections are held under first past the post (and in London multi-member plurality), seats won and lost can be a poor guide to how well a party has done in the ballot box. A party whose vote has fallen less than that of their principal rivals may gain seats even though it has lost votes. A third party whose vote is geographically spread may make a substantial advance in votes yet reap little reward in terms of seats. Meanwhile, even if these issues do not arise, seats won and lost only provide an indication of whether a party has lost or gained ground as compared with when the seats up for grabs were last contested – which this year, as is usually the case, was four years ago.

Yet we cannot simply add up votes cast either (even if we had the resource to collect them all on election night). In England (unlike Scotland and Wales) it is never the case that the whole country votes in local elections at the same time. The places that vote one year are politically different from those that vote in another. Given all these limitations, a key indicator of party performance that has come to be part of the ritual of local election night is the calculation of a ‘projected national share’ (PNS). This is an estimate of the share of the vote that the principal parties would have won in a GB-wide general election if voters across the country as a whole had behaved in the same way as those who actually voted in the local elections that year in England. It provides a single, seemingly straightforward measure of party performance that can tell us not only how well or badly a party has done as compared with four years ago, but also as compared with any previous local elections for which a PNS is available – even though the places in which local elections are held varies considerably from one year to the next.

Yet almost inevitably answering such a ‘what if’ question is not as straightforward as it might seem. Given the large number of wards being contested, the calculation of the PNS has to be made on the basis of a sub-sample of the local contests. None of the parties fight all of the wards being contested, and some may well fight fewer wards than others. At the same time, local election results in England tell us nothing about the performance of the nationalist parties in Scotland and in Wales. Any estimate of the PNS is affected by the decisions that are made about how best to address these issues. It is thus not surprising that there have often been some differences between the PNS that we have calculated for the BBC at previous local elections and that calculated by the local election experts, Colin Rallings and Michael Thrasher of Plymouth University, whose National Equivalent Vote (NEV) appears each year in The Sunday Times. 

Those differences are typically limited with neither the PNS or NEV consistently better for any party. But since 2015 there has been a tendency for the PNS to be higher for Liberal Democrats and Others, and correspondingly lower for the Conservative and Labour than the NEV series. This can be seen in the table below. 

 NEV:   PNS:   Diff:   
 ConLabLDOtherConLabLDOtherConLabLDOth
20132629143125291432-100+1
20143031112829311327 -10+2-1
20153631102335291125-1-2+1+2
20163233142130311524-2-2+1+3
20173928181537281817-200+2
20183736141335351614-2-1+2+1
20193131172128281925-3-3+2+4
20214030151536291718-4-1+2+3

It is not entirely clear why these gaps have emerged. Here we aim to explain some of the key features of the PNS methodology that might help explain the difference. In doing so, our aim is not to suggest that one approach is better than another, but rather to explain some of the decisions we have made that can have an impact on the figures we publish. 

Continue reading Understanding the Local Elections Projected National Share (PNS) in 2022

Election analysis and forecasting