
By Stephen Fisher, 1st May 2024.
Changes in vote intention opinion polls typically provide an indication of headline net seat changes at local elections. Most of the seats up this year were last fought in 2021. The following table shows how party support in the opinion polls has changed since then.
Table 1. Opinion poll changes from 2021 locals to 2024 locals
| % | 2021 polls | 2024 polls | Change |
| Con | 41 | 23 | -18 |
| Lab | 36 | 44 | +8 |
| LD | 7 | 9 | +2 |
| Reform | 3 | 12 | +9 |
| Green | 5 | 6 | +1 |
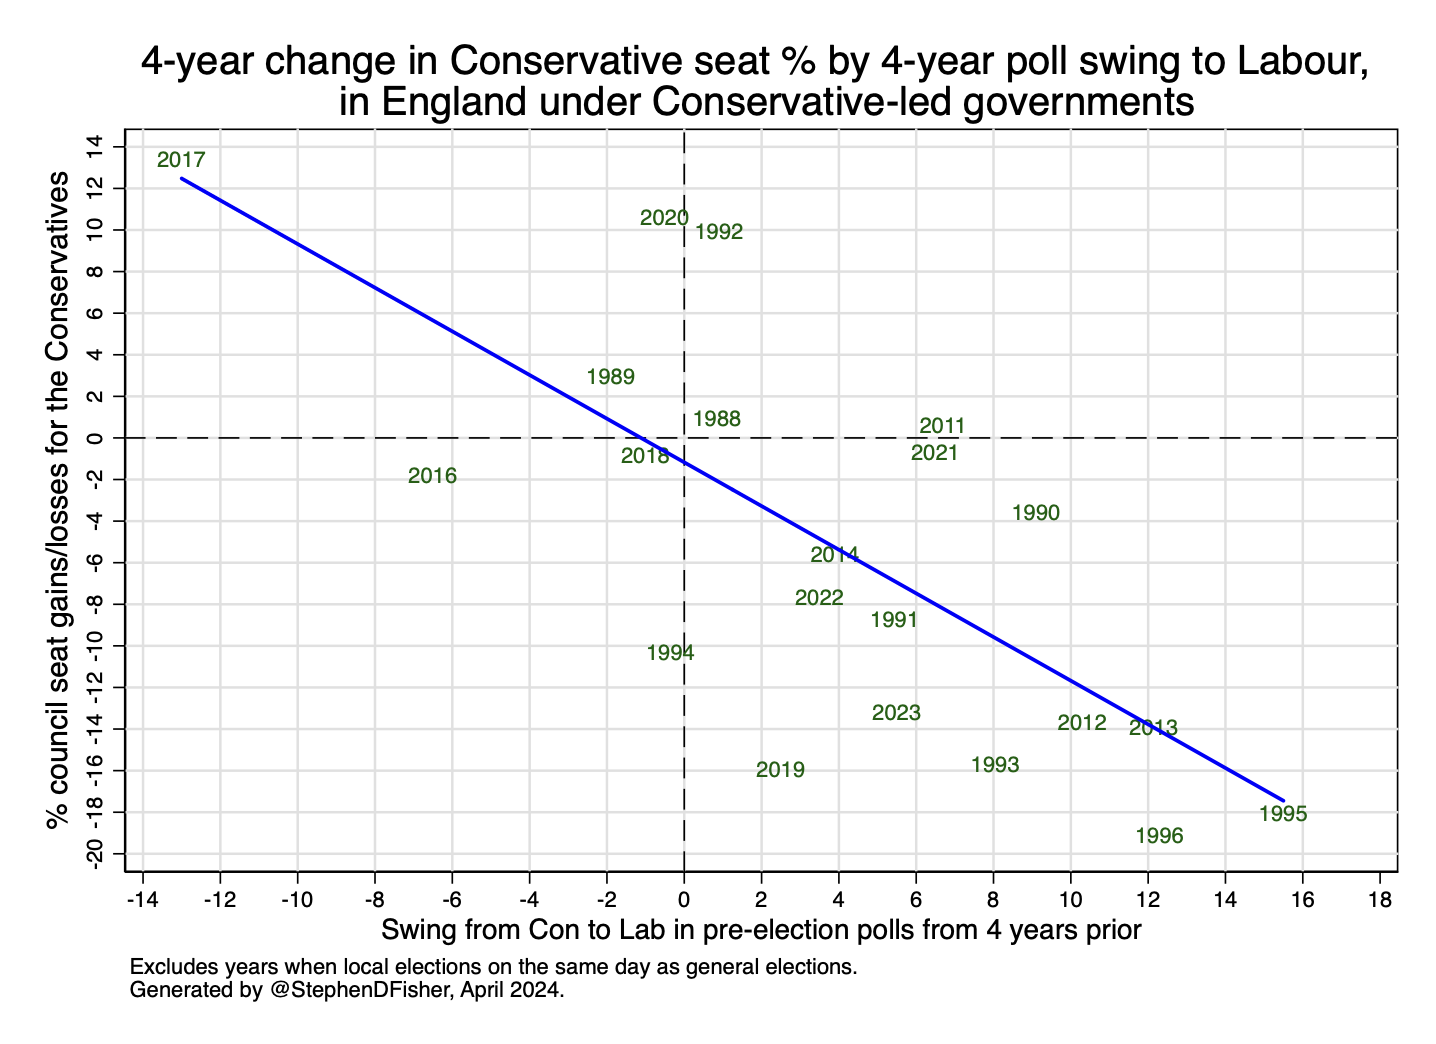
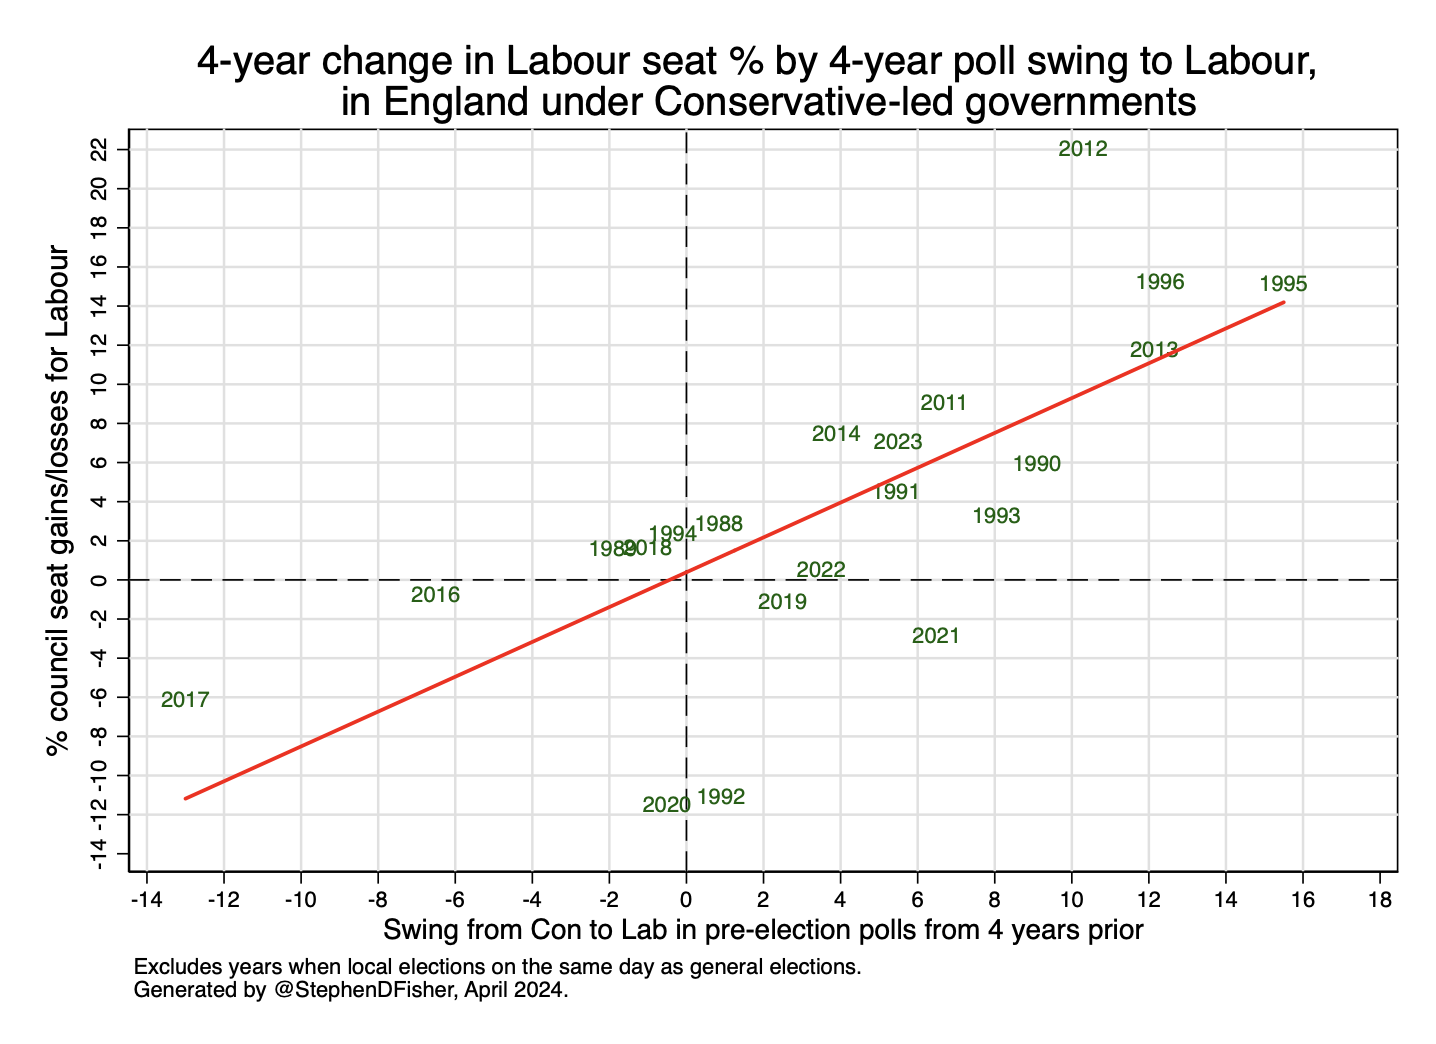
Those changes imply a 13-point swing from Conservative to Labour. The graphs below show broadly how that might translate into seat gains for Labour and losses for the Conservatives as percentages of the 2650+ seats up this year. The 13 point swing should put this week’s local election results on par with those for 1995, 1996 and 2013.
Liberal Democrat local seat tallies at the national level have historically been linked primarily on the swing between them and the Conservatives. That swing is 10-points to the Liberal Democrats this time.
Table 2 below shows predictions from the regression models. The figure for Others is just an accounting balance. The Conservative and Labour models are based on Con-Lab swing and the Lib Dem model is based on Con-LD swing. The three are estimated separately. They do not take direct account of the rise in the Reform party share, nor perhaps more importantly given their success last year, the big rise in the number of Green party candidates relative to the number of seats up for election.
Table 2. Model based forecasts for English local election net seat gains/losses for 2024
| Forecast | |
| Con | -390 |
| Lab | +320 |
| LD | +100 |
| Others | -30 |
Based on last year’s experience, I would expect the Conservatives to do worse than the model suggests, and the Liberal Democrats and Others (mainly Greens) to do better.
Colin Rallings and Michael Thrasher have said that, “if the Conservatives repeat their poor performance of 2023, when the NEV put them below 30%, they stand to lose up to 500 seats – half their councillors facing election. Labour may make about 300 gains, with the Liberal Democrats and Greens both likely to advance.” Note that is a conditional prediction. The condition is not a very demanding one. There has been a 2.5-point swing from Conservatives to Labour in the opinion polls since last year. On that basis the local election results should be worse for the Conservatives this year, not simply on par with last year.
Post-mortem for 2023 forecasts
Table 3 shows the forecasts from last year and the actual outcomes. While Others were only up 49 overall, the Green party made 231 gains, while other parties and independents collectively suffered 182 net losses.
Table 3. Forecasts and actual local election net seat gains/losses for 2023
| Elections Etc Forecast | Rallings & Thrasher (given 6% swing) | Electoral Calculus Forecast | Actual | |
| Con | -490 | -1000 | -258 | -1059 |
| Lab | +400 | +700 | +408 | +578 |
| LD | +20 | -39 | +432 | |
| Others (inc Green) | +70 | +49 | ||
| Green | -35 | +231 |
Last year Colin Rallings and Michael Thrasher correctly anticipated the scale of the Conservative losses when they said, “taking the likely previous outcome in newly drawn wards into account, a 6% swing from the Conservatives to Labour since 2019 could see Conservative seat losses breaching 1,000.” But they also added, “with Labour registering 700 or so gains,” which did not transpire. While the Conservatives were down by 1059 seats, Labour made 578 net gains.
One intriguing thing about their conditional prediction from last year is that the swing from 2019 to 2023 in the National Equivalent Vote (NEV) was not 6% that was the premise of their prediction, but just 3.5%. So, the Rallings and Thrasher prediction of more than a thousand Conservative losses came true despite a much more modest swing in the local elections share of the vote than they were assuming.
That lower swing in the NEV might have been part of the reason Labour did not make the +700 gains Rallings and Thrasher predicted. But they did do better than the polls predicted according to my model, as Table 3 above shows. That was in marked contrast to the 2021 and 2022 local elections, when Labour did less well than the opinion polls and the historical relationship between polls and net seat change suggested.
The Liberal Democrats have tended to overperform my model since the coalition government ended in 2015. They did so massively last year. Even though continued overperformance relative to the basic model seems reasonable again this year, it cannot work forever. So I have again declined to adjust the model in a way that implies the party will outperform the polls indefinitely.
