Local elections 2025 summary

By Stephen Fisher, 2nd May 2025.

Updated with all of Thursday’s election results in. That is 23 councils, 1639 seats across 1399 wards/county electoral divisions, 6 directly-elected mayoralties, and 1 parliamentary by-election.

Verdict: 

Extraordinary for Reform, good for the Liberal Democrats, mixed for Greens, bad for Labour, and extremely bad for the Conservatives.

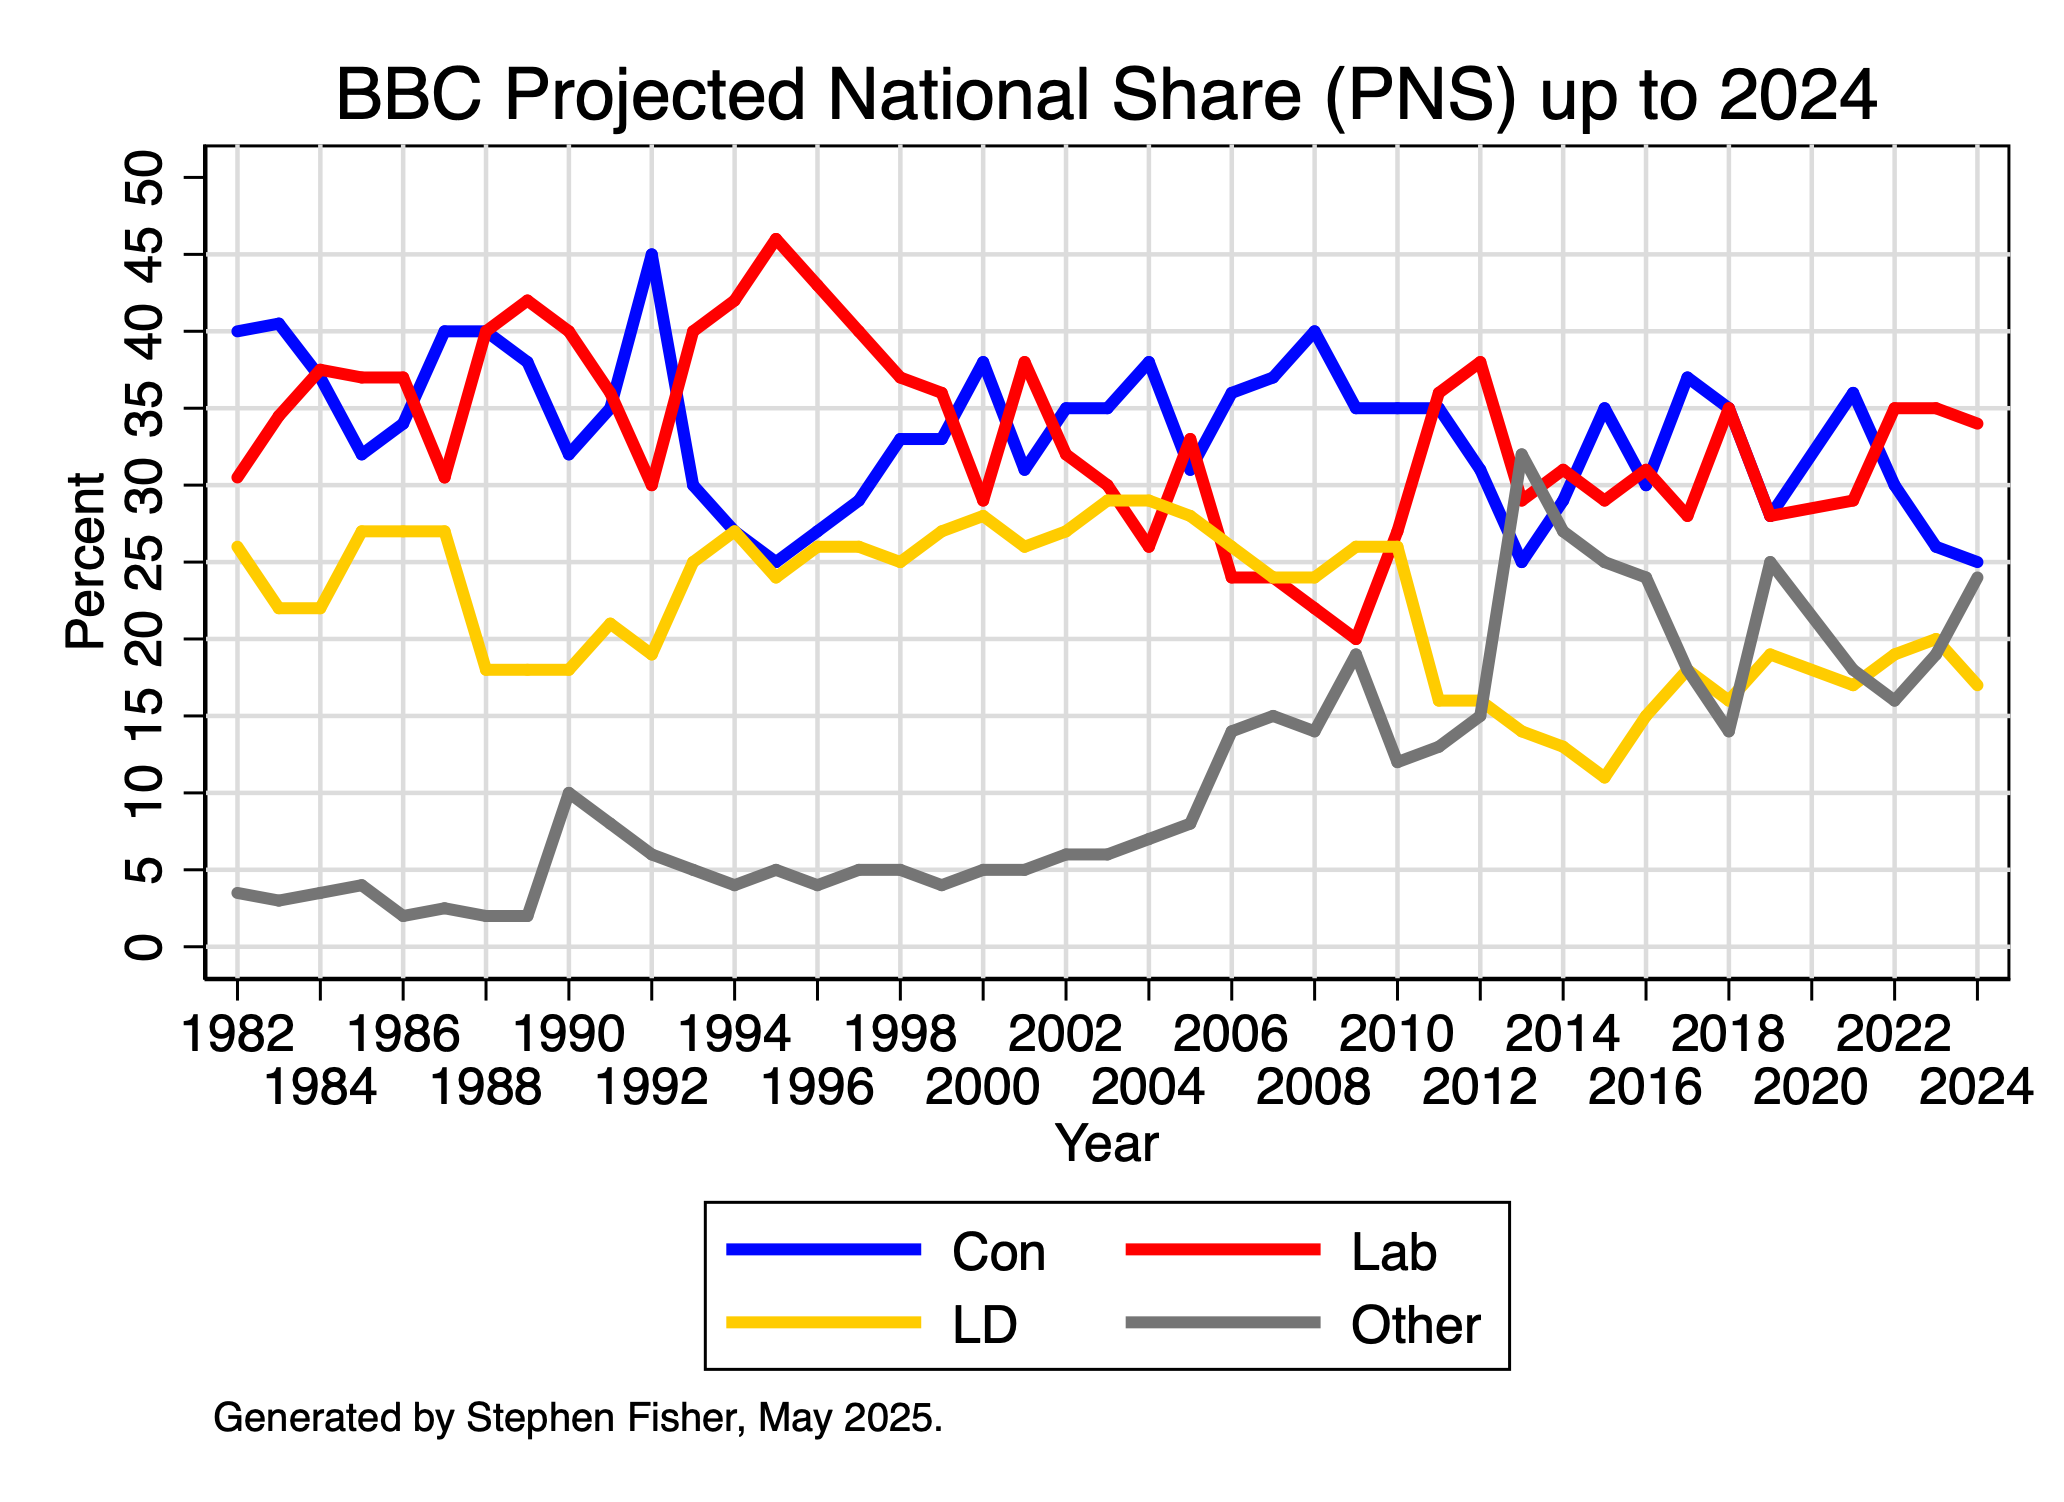
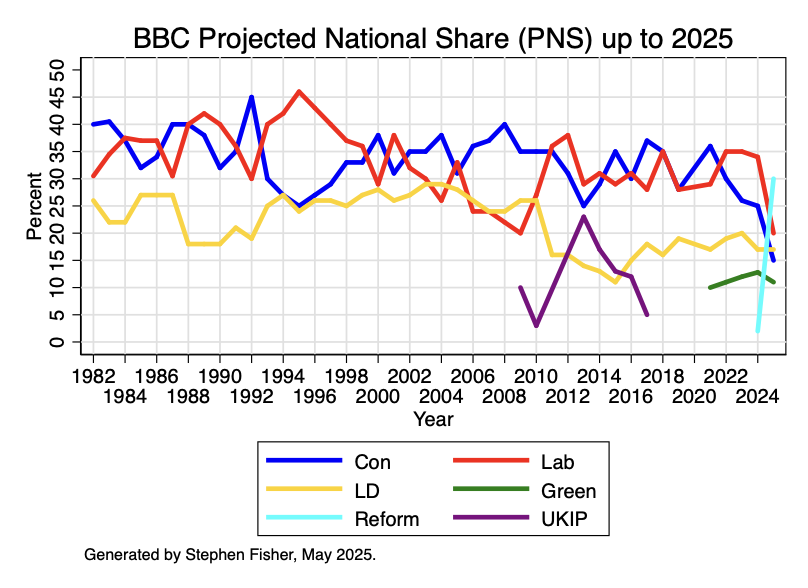
The graph below gives you a sense of how dramatically things changed this year. For an explainer of the PNS see here.

Reform UK:

  • Top of the poll, with 30% in the BBC Projected National Share (PNS) of the vote, up from just 2% in last year’s local elections (due to not fielding many candidates in 2023). Reform comfortably beat UKIP’s best result of 23% in 2013.
  • Won control of +10 councils, despite starting with no seats at all: Derbyshire, Doncaster, Durham, Kent, Lancashire, Lincolnshire, North Northamptonshire, West Northamptonshire, Nottinghamshire, and Staffordshire. 
  • Largest party on a further 4 councils that are “No Overall Control”, so 14 out of 23 in total: Cornwall, Leicestershire, Warwickshire, and Worcestershire.
  • Won the popular vote in 14 authorities.
  • Won the Runcorn and Helsby parliamentary by-election, albeit by just 6 votes, with a 17-point swing. Overturning a majority 34 points or more has only happened in 17 previous by-elections.
  • Won 677 council seats: 41% of the total.
  • Won the Greater Lincolnshire and Hull & East Yorkshire mayoralties, and came a close second in Doncaster, North Tyneside and the West of England
Continue reading Local elections 2025 summary

Understanding the Local Elections Projected National Share (PNS) in 2025

by John Curtice and Stephen Fisher, 1st May 2025.

            One of the highlights of the BBC’s coverage of local elections is the Projected National Share (PNS). This is an estimate of what the GB share of the vote would have been if (a) local elections had been held everywhere, (b) the outcome where there were no elections mirrored the pattern where there were, and (c) the principal parties contested all the seats.

            The aim is to provide a summary statistic that is comparable across local election years irrespective of the particular mix of places that have local elections in any particular year, a mix that varies considerably from year to year. 

             This year’s local elections, for example, take place primarily in rural shire county England. Most of them are places that vote Conservative in especially high numbers. In the general election last July, for example, the Conservatives were neck and neck with Labour rather than 11 points behind. They are also places that voted more heavily for Leave in the 2016 referendum. The PNS is designed, among other things, to remove this unrepresentative character.

However, there are a number of key challenges that make it particularly difficult to calculate a PNS for this year’s elections. In this blog we outline those challenges and explain how we are addressing them.  

Continue reading Understanding the Local Elections Projected National Share (PNS) in 2025