
Stephen Fisher, 19th September
Alex Salmond claimed that there were no No votes, just deferred Yes votes. They were deferred too late for the independence cause. But taking that attitude is possibly the best way of explaining the overall No vote in yesterday’s Scottish Independence referendum.
It is much easier to ask what factors led so many people to vote Yes than it is to ask why more people voted No. Up to a month ago the polls showed large leads for No. Voting to stay in the union was the default position. The key question is how the Yes camp managed to come so close even if they still did not actually manage to win.
The first issue to address is whether they really did come close. The final poll of polls was Yes 48 to No 52, but the result was Yes 45 to No 55. Although the difference was within the margin of error for a single poll, all six final polls were so close together that they all over-estimated the Yes vote as previous referendums and other factors suggested they would. YouGov re-interviewed some of their previous poll respondents after they voted and found that there was both higher turnout among the No supporters and a small shift of Yes support to No at the last moment, i.e. some differential turnout and some late swing to No that would help account for the earlier overestimation. The YouGov prediction after the polls shut was Yes 46 No 54; very close to the actual result.
Despite the overestimated Yes vote during the campaign, the final result for Yes was still somewhat higher than the polls were suggesting it would been a month ago. So the idea that the race tightened in the last few weeks is no fiction. Moreover, as the following analysis will show, the pattern of the results by council area support some of the key findings about which kinds of people were most persuaded by the case for independence.
Perhaps the main reason the Yes campaign failed is that they didn’t convince enough people that they and Scotland as a whole would be better off with independence. But if economic issues mattered then we should expect those suffering most economic hardship to feel the need to change most urgently.
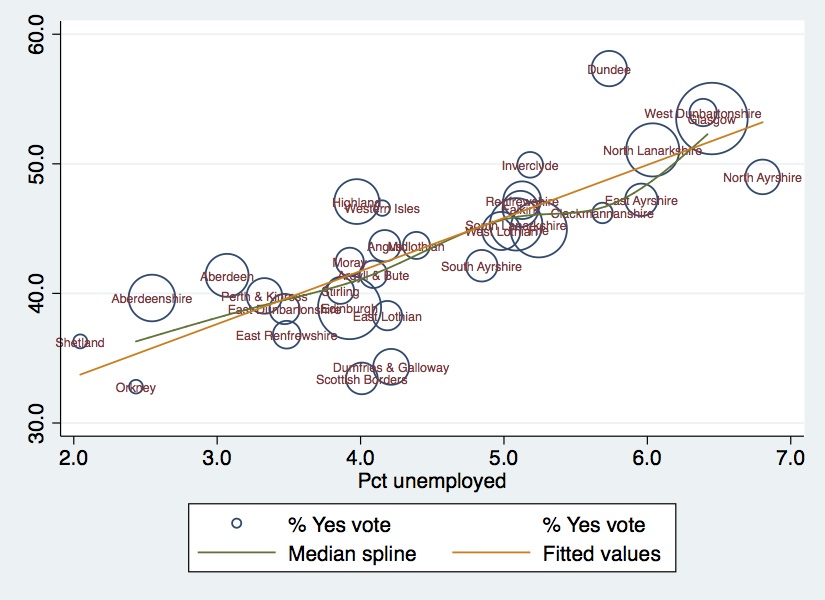
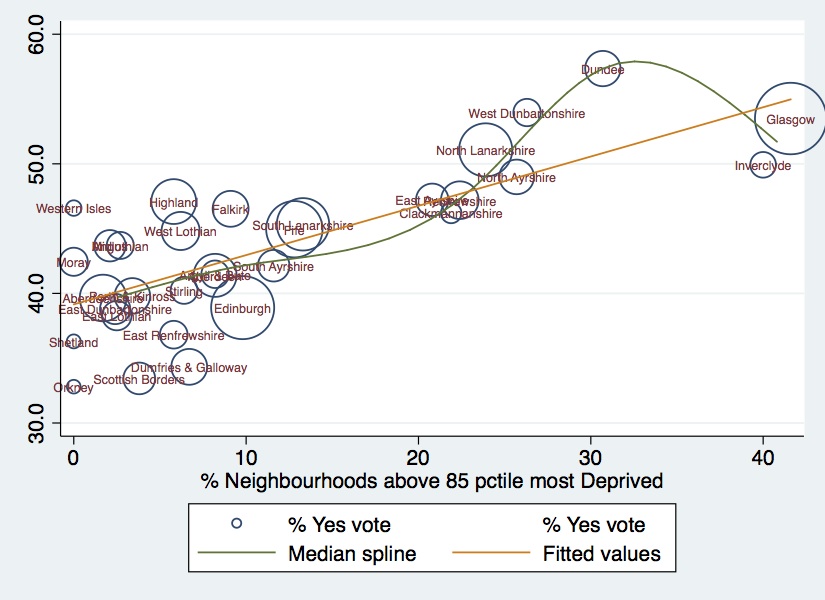
The following two graphs show that those in relatively deprived areas and areas with higher unemployment were much more likely to vote for independence. Indeed the only council areas which voted Yes had unemployment rates of 5% or more (as a percentage of the electorate not active labour force as usually quoted). This fits with the findings from opinion polls which further showed that working class people were more likely than middle class people to vote yes. So it seems that economic hardship led people in the hardest hit areas to conclude that economic management from Westminster was not working for them.
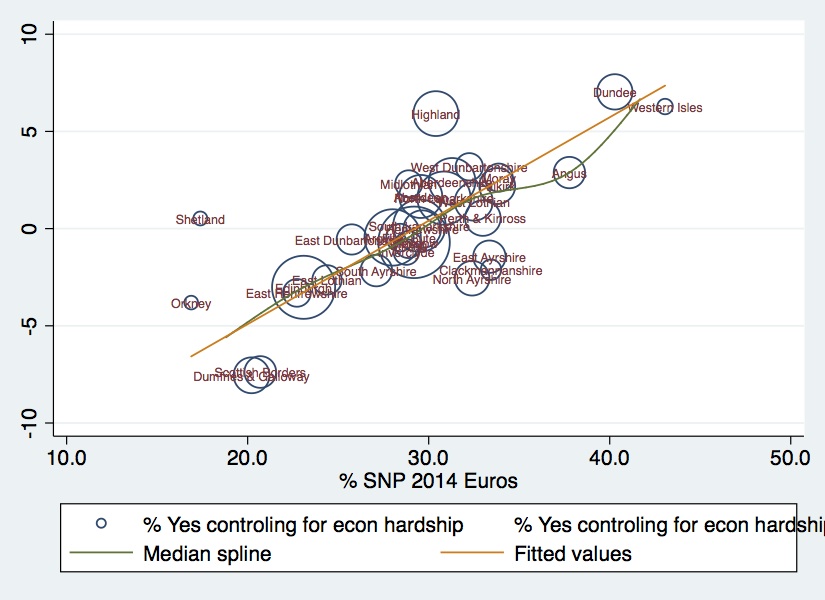
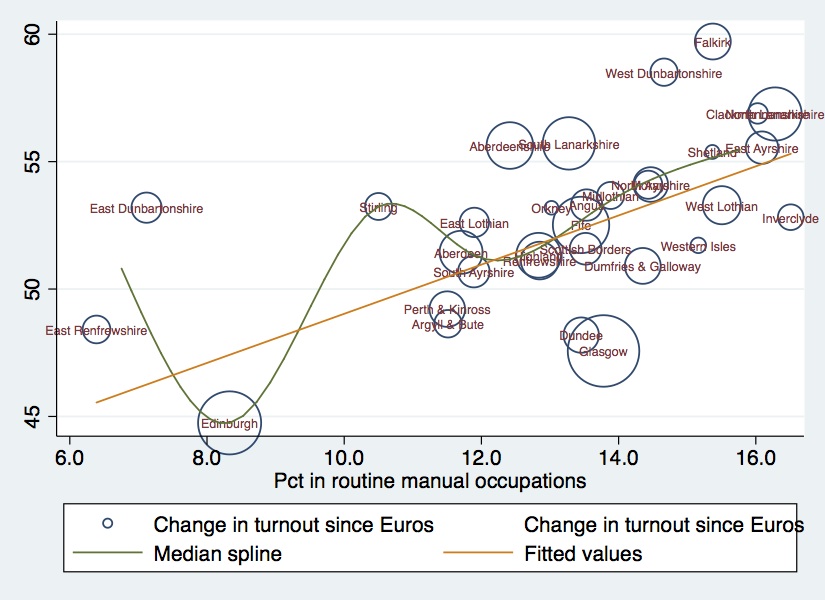
After accounting for these socio-economic factors, there were also visible effects of prior SNP support. The following graph shows the correlation between the Yes vote and the SNP share of the vote at the Euro elections earlier this year, but after controlling for the effects of unemployment and deprivation shown above. (More technically the graph shows the residuals from a linear regression model.) Only after controlling for the effects of socio-economic circumstances is there such a clear relationship between the Yes vote and SNP support. Indeed the fact that only one of their strong holds voted for independence (Dundee) is due to the fact that socio-economic factors seemed to be more important factors than prior nationalist support.
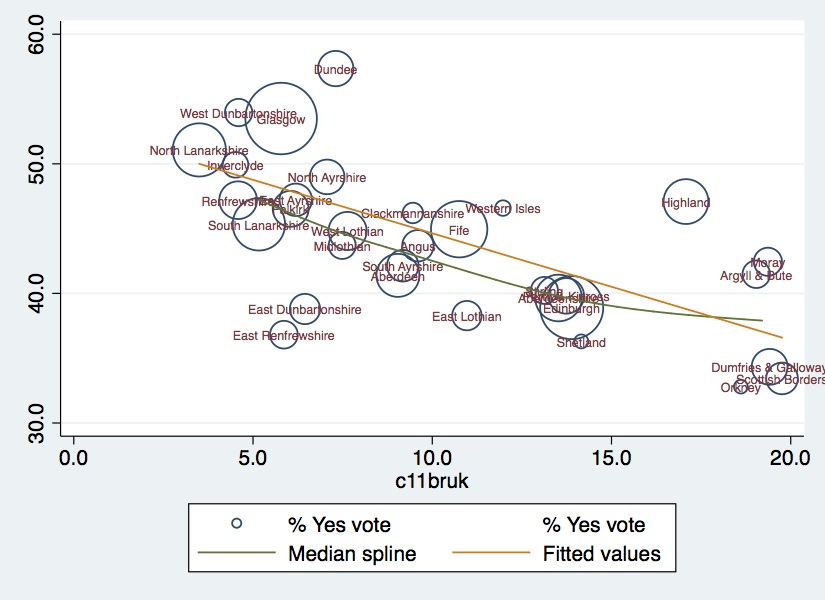
Another key group that were more likely to report voting Yes were those with Scottish rather than British Identity. In the Ipsos MORI poll published on Wednesday, 84% of those who described themselves as Scottish rather than British said they would vote Yes compared with only 26% of those who felt equally Scottish and British. The effects of national identity are visible in the results, and related to this the graph below shows that support for independence was considerably lower in those places where more of the voters were born elsewhere in the UK (England, Wales or Northern Ireland).
Putting these analyses together, it looks like the Yes vote was sustained in large part by a coalition of nationalist true believers and the economically marginalised hoping for better prospects from an independent Scotland.
Turnout
Participation in this referendum was unprecedented. At 84.5%, turnout was higher than at any previous Scotland wide ballot, and only narrowly pipped the UK turnout record (since female enfranchisement) of 83.9% in 1950. But given turnout in recent elections has tended to be much closer to 65% the increase of 20% is remarkable. While it has been praised as a break through in political engagement by some, it probably reflects mainly the importance of the vote and we should bear in mind that turnouts of 80%+ are still common in several other democracies, especially in Scandinavia.
Although turnout was high, between 75% and 90%, everywhere and went up since the Euro elections in May by between 45 and 60 points everywhere, there was some variation in the pattern of the results. It went up more in working class areas than in more middle class areas, thereby somewhat closing the traditional social class gap in turnout.
This does suggest that the Yes campaign might be able to claim some credit for mobilizing voters in working class areas. But it wasn’t enough to counter balance the stronger turnout and higher No shares of the vote in more middle class areas. Overall the correlation between turnout and the Yes share was negative, not positive as one would expect if the Yes side were mobilizing more supporters.
Acknowledgements: Thanks to John Curtice, Rob Ford and the BBC for help with data, and to Rob for comments.

I thought this was the most interesting part of your piece:
“Only after controlling for the effects of socio-economic circumstances is there such a clear relationship between the Yes vote and SNP support. [S]ocio-economic factors seemed to be more important factors than prior nationalist support.”
I’d been wondering about that, because it had struck me just how little overlap there was between the electoral map for the referendum results and the maps for prior SNP election results. I mean, the SNP got 44% of the vote in the most recent Scottish elections; YES won 45% of the referendum vote. You’d expect some correlation. But at first blush there didn’t seem to be any – I even compiled some side-by-side comparison maps in a quick blog post about exactly this question: http://observationalism.com/2014/09/19/last-nights-referendum-on-scottish-independence-poses-a-geographic-paradox/
Your post teases out that there was some correlation, but that it was swamped by the more important socio-economic factors, which is intriguing. Was the same true for the devolution referendum in 1997?
The Yes vote in 1997 was strongest in the west central belt (6:1 majority for Yes in Glasgow, for example), which is quite similar to 2014. All four areas that voted Yes in 2014 were above average for Yes in 1997, although Dundee (the most strongly Yes in 2014) was pretty close to average.
The Yes vote in 1997 was weakest in the periphery (Orkney, Shetland, Borders, Dumfries/Galloway) and in areas of relative Conservative strength (East Renfrewshire, Perth/Kinross, Dumfries/Galloway). All of those areas were also weak for Yes in 2014.
In terms of comparing SNP electoral success to referendum results, you have to bear in mind the peculiarity of Scottish elections. There has been for a long time four party politics in Scotland (a recent development in England), although in 2011 this effectively switched to three parties with the collapse in LibDem support. The effect of four party system is that there has been a lot of tactical voting.
The SNP’s success in NE rural areas has often been due to tactical voting by Labour and Liberals against the Tories, rather than outright support for Scottish independence. The promise of a referendum acted as a kind of firewall which allowed unionists to vote SNP without voting for independence. Some newspapers that are strongly opposed to independence endorsed the SNP in 2007 and/or 2011 because they preferred them to the likely alternative (Labour).
This all suggests there may be some decline in SNP support in their traditional “heartlands”, as these tactical voters realize the consequence of their actions. Yet at the same time there has been some evidence of the SNP making significant progress in traditional Labour areas. I think this creates the potential for a battle where Labour and LibDem try to defend their existing seats from the SNP. Meanwhile, the Tories may win multiple Scottish seats for the first time in decades, possibly at the expense of the SNP.
That was very informative – thank you.
Good analysis. Some of the reason for the weak relationship between prior SNP voting patterns and the referendum relates to tactical voting patterns. The Scottish electorate has become very good at tactical voting which is why there is only one Tory MP and previously zero.
May 2015 is going to be interesting.
In the past you would have had SNP voters willing to vote Labour (or Lib Dem in rural areas) to beat the Tories, and vice versa. I don’t think those tactical voting patterns will persist in the light (heat?) of the referendum. The main beneficiary of this should be the Tories, who could win more seats without many more votes if the tactical voting against them unwinds.
I think the SNP will win significantly more votes than in the 2010GE, but it might not be enough to win more seats because they have a lot of ground to make up in areas of Labour strength before they start winning more than a few of their seats.
A key part of the analysis missing from this article is the correlation between age and voting no – three quarters of those over 55 voted No whereas the majority of those under 55 voted Yes.
When the next referendum comes round, a large number of these more elderly voters will no longer be around to hold back the wishes of their younger compatriots.