
The polls – and our forecast – are very little changed since last week. Labour still have just a one-point lead in our polling average, leading our model to give the Conservatives a 70% chance of winning the most votes come election day. However, our forecast remains much more finely-balanced when it comes to who’ll win the most seats: it’s pretty much a tossup, with the Tories the very, very slight favourites on 51% to Labour’s 49%.
The chances of a hung parliament are again up slightly, to 84%, but the parliamentary arithmetic is more likely to favour Labour than the Tories. Our model suggests an 80% chance that there’d be enough MPs available for Ed Miliband to cobble together a majority (at least for a confidence motion) – although in the vast majority of those cases he’d need the support of the Lib Dems, the SNP, or both.
This week we passed the ‘100 days to go’ mark, so it’s perhaps a good time to reflect on the general approach of our forecasting model for the share of the vote. The analysis of historical polls and votes still suggests government recovery and opposition setback from 100 days out, on average. But there is a lot of noise around the average.
The graphs below looks at the average of the polls between 85 and 115 days out in each election cycle since 1950 and how these compared with the eventual outcome for both the governing and principal opposition parties.
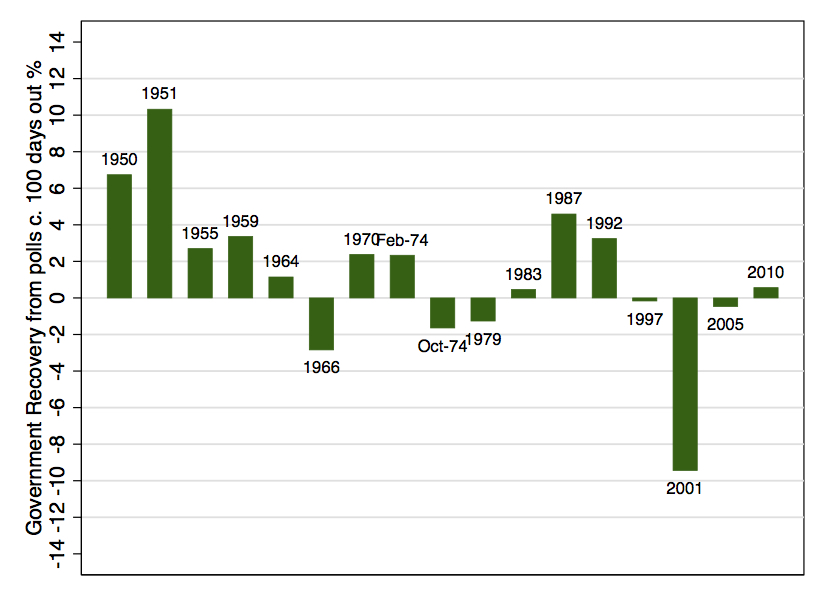
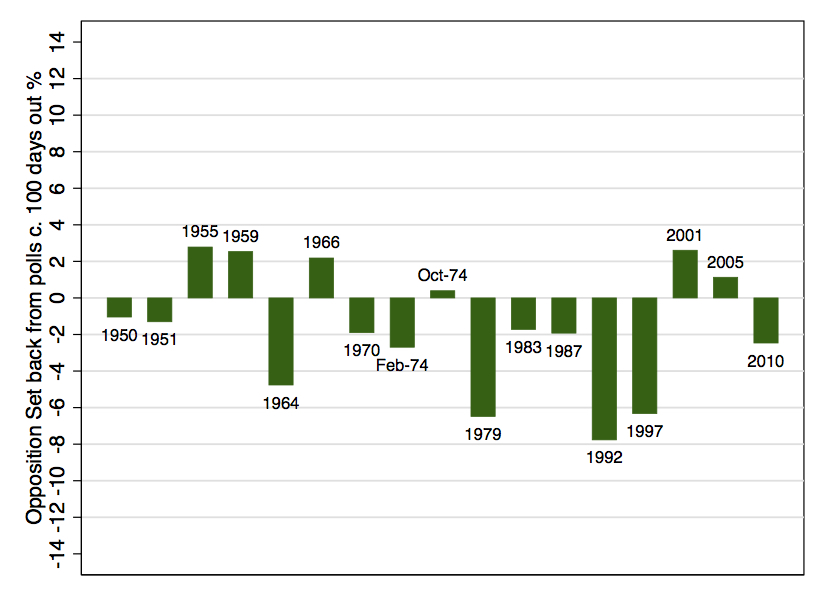
The opposition setback effect has been reasonably consistent since 1970, but the government recovery from this point in the cycle has not been so reliable in more recent elections. A large part of the average government recovery from c.100 days out is driven by the elections in the 1950s.
This wasn’t always the case. Equivalent graphs (eg. for 8 months out) show much more consistent government recoveries. It just happens that, over the last year or so, the Conservatives haven’t made the recovery history suggests they ought to have.
The Tories might take some comfort from the 1987 and 1992 recoveries from 100 days out in the first graph. But the further graphs below, comparing election results to final week polls, shows that in 1992 the polling industry bias or late swing to the Tories was even greater than the measured recovery from 100 days out. In fact, the Tories actually went down in the polls over the last 100 days in 1992, but were saved by the discrepancy between the final polls and the actual election outcome.
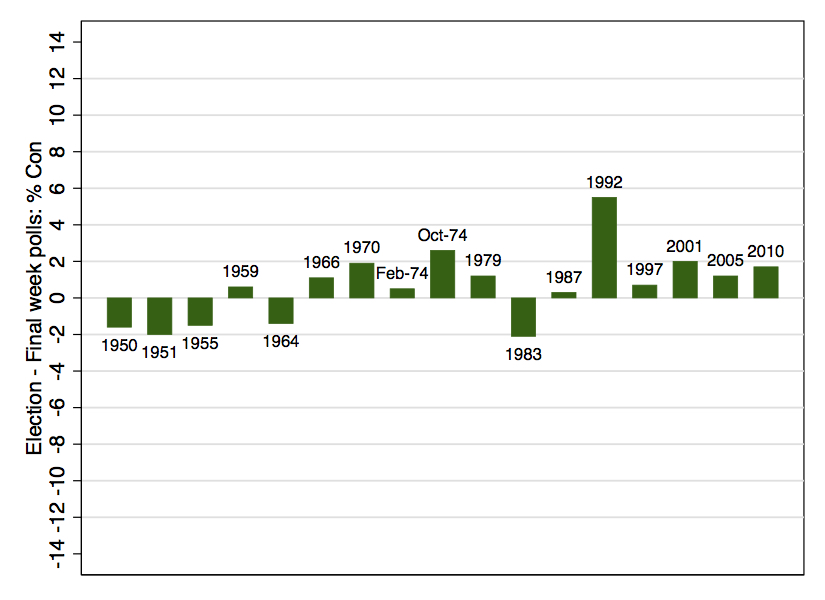
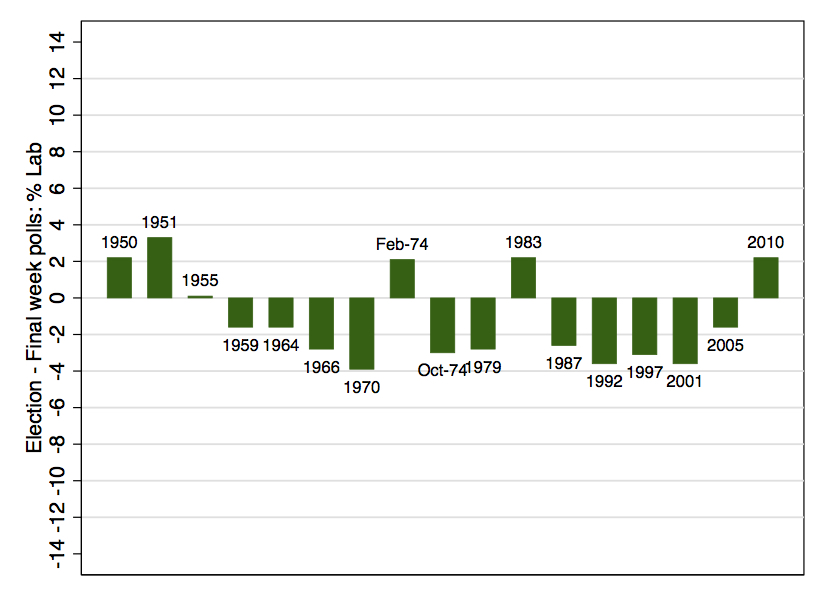
The graphs for election results relative to final week polls – plus the experience of polls for the European Parliament elections last year – suggest that the polls may be generous to Labour and underestimating the Tories again this year. But it would be unwise to rely on it.
Date of forecast: 30 January 2015
Days till the election: 97
Inputted current average poll shares
Con: 32%
Lab: 33%
LD: 8%
UKIP: 15%
Others: 12%
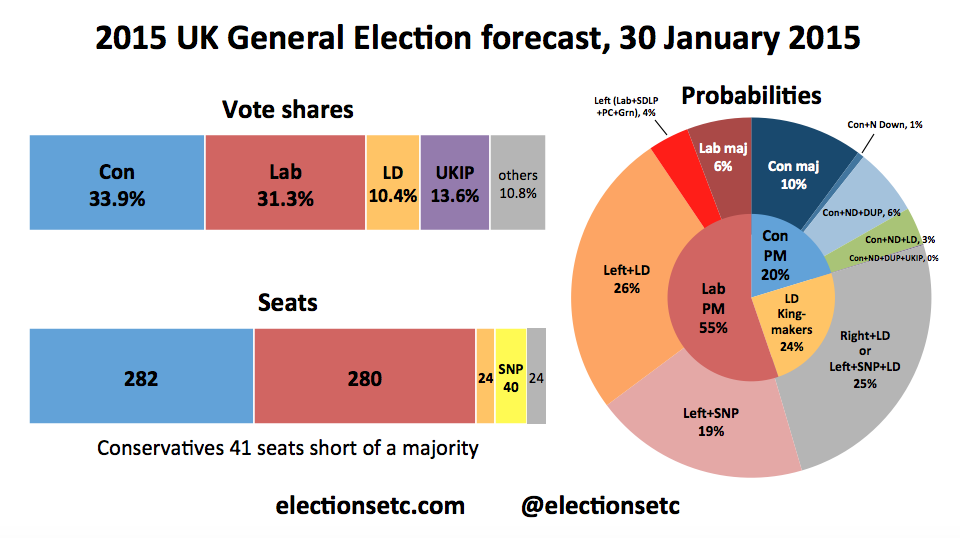
Forecast GB Vote Shares (with 95% Prediction Intervals)
Con: 33.9% (±5, i.e. 29% – 38%)
Lab: 31.3% (±5, i.e. 27% – 36%)
LD: 10.4% (±5, i.e. 6% – 15%)
UKIP: 13.6% (±5, i.e. 9% – 18%)
Others: 10.8% (±2, i.e. 9% – 13%)
Forecast Scotland Vote Shares (with 95% Prediction Intervals)
SNP: 43% (±5, i.e. 38% – 48%)
Labour: 30% (±5, i.e. 25% – 35%)
Forecast GB Seats (with 95% Prediction Intervals)
Con: 282 (234 – 336)
Lab: 280 (228 – 325)
LD: 24 (13 – 38)
SNP: 40 (26 – 50)
PC: 3
UKIP: 3
Grn: 1
(May not sum to 632 due to rounding of sums of probabilities. Prediction intervals not yet available for UKIP, PC and Grn.)
Central forecast: Con largest party, but short of a majority by 41
(Criterion for majority now changed to 323 not 326, assuming Sinn Fein win 5 seats and do not take them.)
Probabilities of key outcomes
Con largest: 51%
Lab largest: 49%
Hung Parliament: 84%
… with Con largest: 41%
… with Lab largest: 43%
Probabilities of predicted government outcomes:
(See here for explanations and assumptions)
Con majority: 10%
Con+NDown: 1%
Con+ND+DUP: 6%
Con+ND+LD: 9%
… with Con+ND+DUP also possible: 6%
… without Con+ND+DUP also possible: 3%
Con+ND+DUP+UKIP: 0%
Lab majority: 6%
Left (Lab+SDLP+PC+Grn): 4%
Left+LD: 26%
… with LD as kingmakers: 1%
… without LD as kingmakers: 25%
Left+SNP: 44%
… with Left+LD also possible: 25%
… without Left+LD possible: 19%
Left+SNP+LD: 25%
… with LD as kingmakers: 24%
… without LD as kingmakers: 1%
LD kingmakers: 24.5%
With a choice between Con+ND+DUP(+UKIP)+LD or
…Lab+SDLP+PC+Grn+LD: 0.5%
…Lab+SDLP+PC+Grn+SNP+LD: 24%
(Probabilities may not sum due to rounding)

Hi, Your method doesn’t seem to take account of the Fixed-term Parliaments Act. Surely in 83 87 2001 2005 (and others) the government called the election because they were doing well in the polls. In other words the ‘government recovery’ and/or ‘opposition setback’ caused the elections rather than the other way round (at least partly). In fact, there are only 4 elections in the last 50 years where the government had gone a full term (as in 2015): 1979 (and this wasn’t really full term but the election wasn’t at a time of govt’s choosing), 1992, 1997 and 2010. It seems too small a sample to draw any firm conclusions from, and show no pattern in terms of ‘government recovery’, although all four show ‘opposition setback’. It’s therefore hard to justify including any adjustment for ‘government recovery’ based on previous election results. I suspect there may well be government recovery in vote share compared to current polling average, but based on UKIP setback helping Con the most.
One year ago today (4th February 2014) a YouGov/Sun opinion poll gave Labour a 6% lead in the polls. A year and a day ago (3rd February 2014) Labour had a 7% lead in an Ipsos/Mori poll.
But since then, the Conservatives have all but wiped out the Labour lead in the polls.
Now here’s the strange thing – the odds on a Conservative overall majority (at the bookies) in the general election have widened from around 3.3/1 a year ago to 5/1 now. Can anyone explain this??
“Time running-out to build a majority” is a short answer to your question. It was already priced-in that the governing party would close the gap in terms of polling and perhaps get a small lead in time; the gap closing has now happened as expected. There is now less time for either major party to build a majority-winning lead, so the odds of a hung parliament are narrowing as time runs out and the odds of a majority lengthen, even though the gap has closed. A general point to make about markets is that only unexpected changes should make a major difference to the price, in this case the odds. Expected changes, e.g. in polling, should be priced-in, in theory so if the polling moves to where it was expected to then the odds shouldn’t change.
Yes, what you write makes sense. And what is even more striking than the shift in odds on a Conservative majority in the next general election is the shift in odds on a Labour outright majority. Currently Labrokes are offering 10 to 1 against this scenario, and Coral and William Hill are offering 9 to 1 against. A far cry from the odds a couple of years ago which, from memory, were (at one point) hovering around evens!