
By John Curtice and Stephen Fisher.
A key summary statistic of the outcome of each year’s annual round of local elections is the so-called Projected National Share (PNS). This is an estimate of the share of the vote that the principal parties would have won in a GB-wide general election if voters across the country as a whole had behaved in the same way as those who actually voted in the local elections. It provides a single, seemingly straightforward measure of party performance that can tell us not only how well or badly a party has done as compared with four years ago (when, typically, most of the seats up for grabs were last contested), but also as compared with any previous local election for which a PNS is available – even though the places in which local elections are held varies considerably from one year to the next.
In this blog we provide some guidance as to how the PNS is being calculated this year by the BBC and how it will be used to project an outcome in terms of House of Commons seats.
One of the key patterns at the 2017 general election was a tendency for those who voted Remain to swing more to Labour than those who voted Leave, while the Conservatives lost ground amongst Remain voters while advancing amongst their Leave counterparts. There was a similar pattern at the local elections both last year and in the 2017 local elections. The Labour vote increased more (or fell less) where the Remain vote was higher in 2016, while the converse was true of the Conservatives. The same may happen again this year – or, equally importantly, maybe the pattern will be reversed thanks to disenchantment among Leave voters with the Conservatives’ failure to deliver Brexit.
Meanwhile, this year’s local elections are being held in most (though not all) provincial England; there are not any elections in London, Scotland or Wales. As a result, the places with elections this year are more pro-Leave than Britain as a whole. On average, the Leave vote at the 2016 referendum was 56%, compared with 52% in Britain as a whole, and 53% in England.
If party performance in an area proves to be correlated with the outcome locally of the EU referendum, there is therefore a risk that the headline figures of gains and losses of seats (and indeed the average change in a party’s share of the vote) will not give an accurate picture of the relative strength of the Conservatives (and Labour) across Britain as a whole. The calculation of the PNS takes this possibility into account.
The process involves analysis of the extent to which party performance in each of the councils where the BBC is collecting the detailed ward by ward voting figures is correlated with the Leave share of the vote in 2016. Using the same approach as that used for the general election exit poll, we will be constructing statistical regression models of the change in each party’s share of the vote, and using these to project the pattern of change in support across all local authorities in Britain, whether they have local elections or not. The resulting estimated changes in party support in each district are then aggregated across Britain as a whole, taking into account the different numbers of electors in each council area. The resulting estimate of the overall change in each party’s share of the vote will then be applied to our baseline 2015 PNS to generate the 2019 PNS. The PNS thus represents an estimate of what the share of the vote would have been if local elections had been held across the whole of Britain.
Another important feature of the PNS is that, in trying to approximate the circumstances of a general election, it focuses on how the three main parties that are contesting seats on an extensive basis (that is, the Conservatives, Labour, and the Liberal Democrats) perform when they compete against each other. Many wards at these local elections will not feature a candidate from one or more of these parties. While the Conservatives are contesting nearly 8,000 of the more than 8,400 seats up for grabs, Labour are fighting only 6,500 and the Liberal Democrats an even more modest 4,400. The 40 council areas where the BBC are collecting detailed results are chosen as places where all three of these parties contested all or most of the wards both in 2015 and this year. This is an important foundation behind the claim that the PNS is an estimate of the share of the vote that the principal parties would have won in a GB-wide general election if voters across the country as a whole had behaved in the same way as those who actually voted in the local elections.
Projecting seats in the House of Commons from the PNS
In what Peter Snow often described as ‘just a bit of fun’, the PNS is also used to estimate the composition of the House of Commons in a contemporaneous general election. This estimate is simply a statement of what the outcome in seats would be if the changes in party support implied by the PNS since the last general election were to be replicated across the country as a whole.
However, we know that the level of party performance in local elections tends to differ somewhat from that in a parliamentary election, even when the two are held on the same day. In particular, the Liberal Democrats tend to perform rather better in local elections, and both the Conservatives and Labour rather worse.
Therefore, in calculating the projected House of Commons, we take into account the difference between each party’s general and local election performances in 2010 and 2015, when local elections were held on the same day as a general election. On average across those two elections the Conservative share of the vote in the local election PNS was 2.3 points lower than in the general elections, and the Labour share 2.8 points lower, while the Liberal Democrats’ share was 2.9 points higher and that for all others combined, 2.2 points higher. We can call this the local election performance adjustment.
The forecast House of Commons will then be calculated by applying for each party the following changes in shares of the vote across all constituencies:
2019 PNS – 2017 General Election share – (Party’s local election adjustment)
We also assume that there is no change in SNP and PC support since the 2017 election. Of course, one potentially important caveat is that the local elections will not tell us anything about how well either the two new parties, the Brexit Party or Change UK, might do in a general election, as they are not contesting any of the seats at this year’s local elections.
This adjustment was first used by the BBC in its coverage of the 2018 local elections.
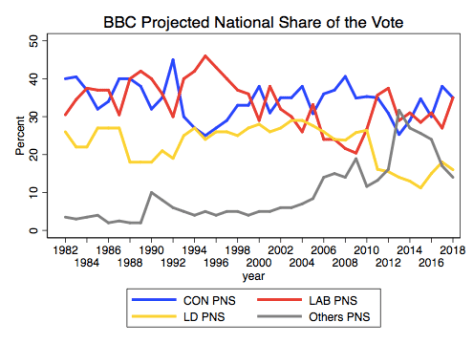
The data used to create the above figure are in the table below.
| Con | Lab | LD | Others | |
| 1982 | 40 | 30.5 | 26 | 3.5 |
| 1983 | 40.5 | 34.5 | 22 | 3 |
| 1984 | 37 | 37.5 | 22 | 3.5 |
| 1985 | 32 | 37 | 27 | 4 |
| 1986 | 34 | 37 | 27 | 2 |
| 1987 | 40 | 30.5 | 27 | 2.5 |
| 1988 | 40 | 40 | 18 | 2 |
| 1989 | 38 | 42 | 18 | 2 |
| 1990 | 32 | 40 | 18 | 10 |
| 1991 | 35 | 36 | 21 | 8 |
| 1992 | 45 | 30 | 19 | 6 |
| 1993 | 30 | 40 | 25 | 5 |
| 1994 | 27 | 42 | 27 | 4 |
| 1995 | 25 | 46 | 24 | 5 |
| 1996 | 27 | 43 | 26 | 4 |
| 1997 | 29 | 40 | 26 | 5 |
| 1998 | 33 | 37 | 25 | 5 |
| 1999 | 33 | 36 | 27 | 4 |
| 2000 | 38 | 29 | 28 | 5 |
| 2001 | 31 | 38 | 26 | 5 |
| 2002 | 35 | 32 | 27 | 6 |
| 2003 | 35 | 30 | 29 | 6 |
| 2004 | 38 | 26 | 29 | 7 |
| 2005 | 31 | 33 | 28 | 8 |
| 2006 | 36 | 24 | 26 | 14 |
| 2007 | 37 | 24 | 24 | 15 |
| 2008 | 41 | 22 | 24 | 13 |
| 2009 | 35 | 20 | 26 | 19 |
| 2010 | 35 | 27 | 26 | 12 |
| 2011 | 35 | 36 | 16 | 13 |
| 2012 | 31 | 38 | 16 | 15 |
| 2013 | 25 | 29 | 14 | 32 |
| 2014 | 29 | 31 | 13 | 27 |
| 2015 | 35 | 29 | 11 | 25 |
| 2016 | 30 | 31 | 15 | 24 |
| 2017 | 38 | 27 | 18 | 17 |
| 2018 | 35 | 35 | 16 | 14 |

So, are you calculating PNS for putative Tory-leave, Tory-remain, Labour-leave, Labour-remain, voters, then re-aggregate them into the Tory-Lab options actually available? Or something else.
Perhaps you may have been a tad premature in your assessment.
England scoreboard
PARTY COUNCILLORS CHANGE +/-
Conservative 3320 -1175
Labour 1887 -84
Liberal Democrat 1245 +627
Green 230 +171
UKIP 30 -135
Others 1050 +594
Reblogged this on RogersLongHairBlog and commented:
https://twitter.com/PMotels/status/1124544602625708032
To put it crudely, Bull Shit is Like Farting everybody likes the smell of their own.
https://twitter.com/PMotels/status/1124529616876654593
Very interesting, thank you. Another factor might be, who votes. I don’t know who is around to vote on a Thursday in council elections, but maybe if an election was held when more students are around or is higher profile, the electorate might be younger. Also, the SDP might feature more now they have been re-launched. They have had zero publicity but their policies of Brexit and social democracy would appeal to many Tories I am sure. Probably Labour too who don’t want to be seen as right wing.