
By Stephen Fisher, John Kenny and Rosalind Shorrocks
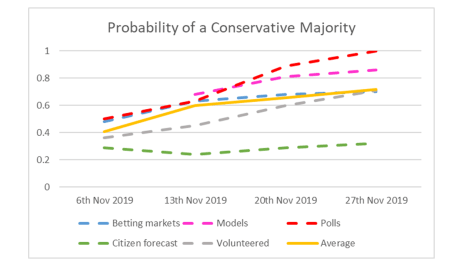
There has not been much change in our combined forecast over the last week. The Conservatives are still apparently headed towards a comfortable majority (55 on average) based on an average forecast vote share lead over Labour of 12 points. The average predicted probability of a Tory majority has crept up to 72%, partly due to increasing confidence in the betting markets and the quantitative forecasting models, as well as the polls. Citizens remain much more sceptical. Concerns that the Liberal Democrats might make little advance continue, and were compounded by the Datapraxis MrP forecast of just 14 seats for the party. Otherwise the Datapraxis forecast was largely in line with other forecasts of headline seats totals. Further MrP based forecasts are due this week, including YouGov’s.
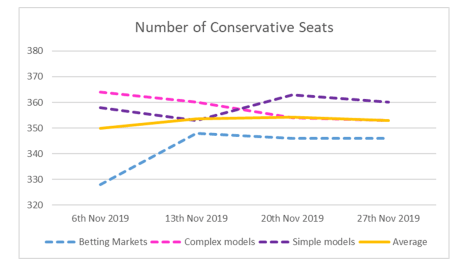
| Seats | Betting Markets | Complex models | Simple models | Average |
| Con | 346 | 353 | 360 | 353 |
| Lab | 210 | 212 | 204 | 209 |
| LD | 25 | 21 | 22 | 23 |
| Brexit | 0 | 0 | 0 | |
| Green | 1 | 1 | 1 | 1 |
| SNP | 45 | 45 | 43 | 44 |
| PC | 4 | 4 | 4 | 4 |
| Con majority | 42 | 55 | 69 | 55 |
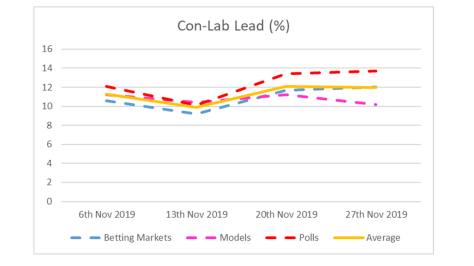
| % GB Vote | Poll aggregates | Betting markets | Models | Average |
| Con | 42.2 | 41.6 | 43.5 | 42.4 |
| Lab | 30.3 | 31.4 | 29.8 | 30.5 |
| Lib Dem | 14.5 | 14.4 | 15.1 | 14.8 |
| Brexit | 4.4 | 4.1 | 2.6 | 3.7 |
| Green | 3.1 | 2.9 | 3.0 | |
| SNP | 3.5 | 3.5 | 3.5 | |
| PC | 0.5 | 0.6 | 0.5 | |
| Con-Lab lead | 12.0 | 10.2 | 13.7 | 12.0 |
| Probabilities | Betting markets | Models | Polls | Citizen forecast | Volunteered | Average |
| Conservative Majority | 0.70 | 0.86 | 1.00 | 0.32 | 0.71 | 0.72 |
| Conservative landslide | 0.11 | 0.11 | ||||
| Boris Johnson next PM | 0.80 | 0.76 | 0.78 | |||
| Jeremy Corbyn next PM | 0.23 | 0.18 | 0.20 |
Methodology
The idea of combining forecasts from different sources has a good track record, though it has to be admitted that our attempts for the 2017 general electionand the 2016 Brexit referendumdid not work out well. See herefor a review of our 2017 forecasts. Also worth noting is the experience of the pollyvote.comcombined forecast of the US presidential elections.
The basic approach is to combine forecasts by averaging them within each category and then average across categories. Since the different sources do not all present similar figures that can be averaged on a like for like basis there are various judgement calls we have had to make on how to treat the data.
The main changes in method this week are: New models are included from DataPraxis (MRP), Mongrain and Opros. As well as Smarkets being used as a source for our party vote shares and our probabilities, this week we have also included their new seat forecast in our betting markets seats estimates.
We don’t included the headline seats tally from the Best for Britain/Focaldata MRP model mainly because we’re not sure they count as official forecasts from the people that generated them. The same is true of figures from other tactical voting websites so far as we know.
Polls
For vote shares, we use the various available polling averages. There are various different polling averages. Some admittedly are quite sophisticated, allowing for house effects, but they are nonetheless estimates of current public opinion and not future votes. We only use polling averages that have been updated in the last 7 days.
To estimate a pseudo-probability of a Conservative majority from the polls, we use uniform change projections for each of the most recent polls from each pollster in the last week. For these we also take estimates for the SNP and Plaid Cymru shares from the most recent polls in Scotland and Wales. The proportion of these projections with a Conservative majority is taken as a pseudo-probability, and similarly we consider the proportion pointing to a majority of over 100 as a pseudo-probability of a landslide.
The pollsters vary considerably in the lead they attribute to the Conservatives. Since nearly all the pollsters are doing polls at least once a week and since we take just the most recent poll from each pollster, our calculated probabilities of a Conservative majority from the polls should not be, and do not seem to be, much affected by any changes in the composition of our poll lead average.
Statistical models
We have divided statistical models into simple (poll average plus uniform swing seats projection) and complex (anything more elaborate but not necessarily particularly complex). Within these categories we simply average the available estimates of seats and shares. We have not excluded any models based on quality, but they do have to be statistical models as opposed to personal guesses. We only include models that have been updated in the last 7 days.
Betting markets
For the seats forecasts we are using just the mid points of the spread betting for the markets. Note that the markets might imply fewer or more seats forecast for the main parties than there are in Britain. This is because the markets are separate for each party and do not need to be consistent collectively.
Betting markets for shares of the vote are typically done in bands. We take the mid points of the (up to) three bands with the highest implied probabilities weighted by their implied probabilities from the betting odds, averaging across bookies.
Citizen forecasts
Some polls ask people what they think that the outcome will be on December 12th. We call these ‘citizen forecasts.’ Different pollsters use different survey questions but they can be combined to generate pseudo-probabilities. We use the proportion of poll respondents who think there will be a Conservative majority, excluding don’t knows and re-percentaging, as the pseudo-probability of a Conservative majority. We similarly use the proportion of poll respondents who think that Boris Johnson will become the next Prime Minister, and similarly generate a pseudo-probability for this outcome excluding the don’t knows. We take the most recent such poll from each pollster in the previous two weeks, although it should be noted that only a few pollsters ask such questions.
In our first 2019 forecast on 6thNovember, we did not exclude the don’t know responses when calculating these pseudo-probabilities, and so the probabilities of Conservative majority/Johnson next PM are artificially lower in the first forecast compared to subsequent forecasts. If we had excluded the don’t knows on 6thNov, the probability of a Conservative majority from the citizen forecasts would have been 0.29 (compared to 0.22) and the probability of Boris Johnson as the next Prime Minister would have been 0.66 (compared to 0.47).
Volunteered forecasts
These come from the Good Judgement Project, which encourages people to forecast the outcomes of various events in order to develop and improve their forecasting skills. The people providing their predictions to the Good Judgement Project are not necessarily experts, but nor can they be seen as a representative sample, and so we report their predictions separately as ‘volunteered’ forecasts.
Estimates come from morning on 27th November 2019.
Sources
Citizen forecasts:
Lord Ashcroft14th-18thNov
Ipsos MORI 16th-18thNov
Opinium 20th-22ndNov
DeltaPoll 21st-23rdNov
Forecasting models:
DataPraxis (MRP)
Authors’ own uniform change projections
Polling Averages (less than a week old):
BBC
Britain Elects
Election Polling
Principalfish
Authors’ own calculations
Prediction markets:
Betfair
Volunteered:
