By Stephen Fisher, Rosalind Shorrocks and John Kenny.
Lots of the forecasts for the 2017 British general election were wrong in pointing to a Conservative majority. Most even suggested an increased majority when the party actually lost one. The well-known exceptions are the exit poll and YouGov multilevel regression and post-stratification (MRP) model. Less commonly remembered are the polls that were within a point of the Conservative-Labour lead and so, by standard uniform change calculations, provided an indication that the Tory majority was in jeopardy.
During the election campaign we ran an exercise combining the different forecasts for shares of the vote, seat tallies, and probabilities of a Conservative majority. Inevitably the combined forecast is only as good as the average of what goes into it, and that average was poor. But since the exercise involved classifying and averaging forecasts by the methodology they used, it is possible to reflect on which types of forecasting method performed better than others.
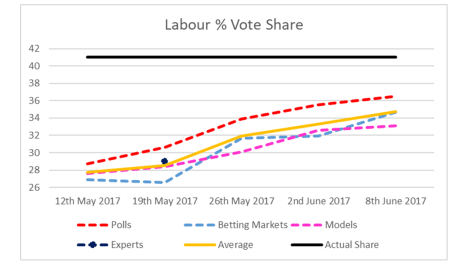
The figure below shows predictions of the Conservative share of the vote over the course of the campaign from the Political Studies Association (PSA) expert survey, betting markets, forecasting models and opinion polls. Strictly speaking polls are snapshots not forecasts, but the final polls performed as well as the experts and better than all the other methods. Consistently the worst source of predictions for the Tory share were the betting markets.
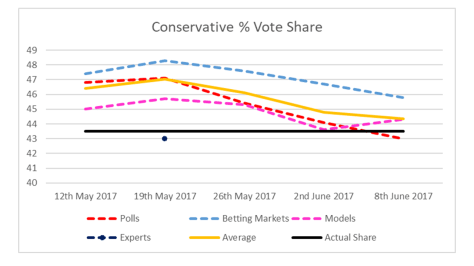 Note: Due to an error in our 2ndJune 2017 betting market calculation (and no way of correcting it at this stage) the betting market line runs direct (interpolates) from 26thMay to the final 8thJune 2017 estimate.
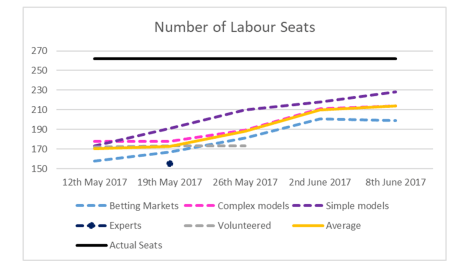
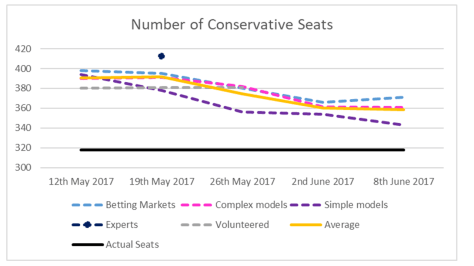
While the experts did well in anticipating the drop in the Conservative vote share during the campaign, they substantially overestimated the number of seats the party would go on to win. Apart from the experts it was the betting markets that did worst, while simple uniform-change projections from the polls did best over the final three weeks.
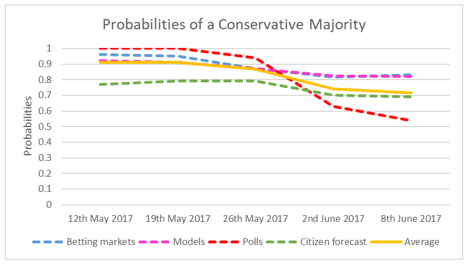
With nearly all forecasts suggesting that Tories would be returned with a comfortable majority, it is unsurprising that the predicted probability of a Conservative majority was over 50% for all forecasting methods (on average). In the figure below, the “polls” line actually represents a crude pseudo-probability based on the proportion of polls pointing to a Conservative majority on uniform swing calculations. The fact that that was close to 50% the day before the election raises questions as to why other approaches were more confident at the same time, especially betting markets. Citizen forecasts (surveys of people asking about their expectations) did better earlier on in the campaign by being more cautious in predicting change, as they typically are.
Averaging forecasting models is problematic because it involves averaging over a diverse set of forecasts, many of which deserve to be treated with more individual attention. The table below shows final model-based forecasts for Conservative and Labour seat totals, sorted by the number of Conservative seats. The YouGov MRP model was the closest overall, and only one to predict the Tories losing their majority.
| Seat forecasts | Con | Lab |
| Actual outcome | 318 | 262 |
| (YouGov MRP) | 302 | 296 |
| Kantar Public | 341 | 232 |
| UKElect | 346 | 222 |
| Forecast UK | 348 | 225.5 |
| PME Politics (Patrick English) | 348 | 223 |
| Elections Etc –Fisher and Goldenberg | 349 | 223 |
| Michael Thrasher | 349 | 215 |
| Ashcroft combined probabilistic estimate (MRP) | 357 | 222 |
| Murr, Stegmaier and Lewis-Beck (citizen forecast) | 361 | 236 |
| Electoral Calculus | 361 | 216 |
| Laurence Janta-Lipinski | 365 | 211 |
| ElectionForecast (Chris Hanretty + Vivyan and Lauderdale) | 366 | 207 |
| Number Cruncher Politics (Matt Singh) | 374 | 207 |
| Nigel Marriott | 375 | 202 |
| Electoral Calculus (local elecs model) | 384 | 187 |
| Election Data | 387 | 186 |
Note: Actual figures count the Speaker as Conservative.
The YouGov MRP model is listed in parentheses because it unfortunately didn’t feature in our final combined forecast. We felt obliged to take it out because of tweets from Freddie Sayers saying “YG model officially dumped!” and from Sam Coates (then at The Times) saying “YouGov say their reputation shd rest on their final poll, not their experimental model” (see here and here.)
All those behind YouGov’s success with MRP should still be congratulated and it is good that the technique is being applied by others. However, it should also be noted that the Ashcroft forecast also made use of MRP but still ended up overestimating the Conservatives. As with any other approach to forecasting based on opinion poll data, the outcome will depend on model specification and particularly the overall balance of support for the parties in the underlying data.
Final polls, including those from non-members of the British Polling Council (BPC) are in the table below.
| GB vote share | Con (%) | Lab (%) | Lead (%) |
| Qriously/Wired | 39 | 41 | -2 |
| Survation | 41 | 40 | 1 |
| Actual outcome | 44 | 41 | 3 |
| SurveyMonkey/The Sun | 42 | 38 | 4 |
| Kantar Public | 43 | 38 | 5 |
| YouGov/The Times | 42 | 35 | 7 |
| Opinium | 43 | 36 | 7 |
| Ipsos MORI/Evening Standard | 44 | 36 | 8 |
| Panelbase | 44 | 36 | 8 |
| ComRes/Independent | 44 | 34 | 10 |
| ICM/The Guardian | 46 | 34 | 12 |
| BMG/The Herald | 46 | 33 | 13 |
Note: % GB vote, counting the Speaker as Conservative.
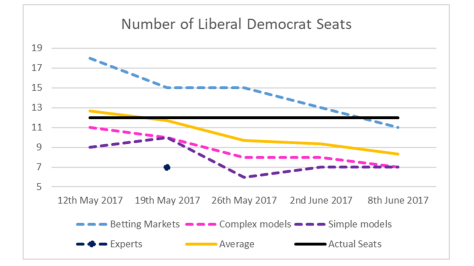
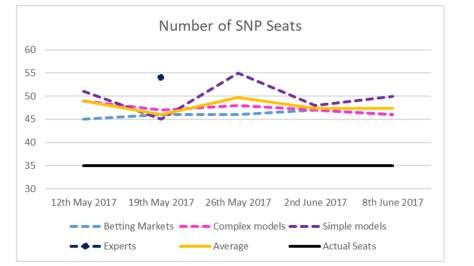
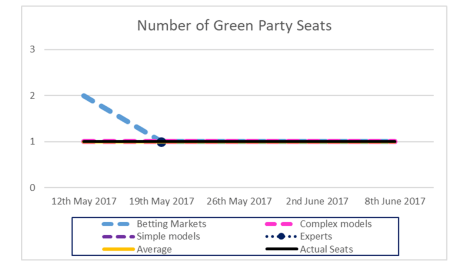
How the different forecasting methods performed, on average, for parties other than the Conservatives can be seen from the various figures below. We leave them for you to view without detailed commentary in the hope that they are self-explanatory.
Just why the different polls and forecasting methods differed from each other in the way they did is not clear. The main general lesson is that the polls, and simple models based on them, tended to do better than other methods, while the betting markets were typically the worst indicators.
We also noted a similar pattern for the 2016 EU referendum, where polls (and citizen forecasts) got much closer to the final result than any of the other forecasting methods. Then, we speculated that perhaps the experience of the polls in the 2015 election had led punters on the betting markets and some forecasters to discount the polls somewhat and rely on other information – such as previous referendum results – for their predictions. Scepticism of the polls was only compounded for 2017 after the final polls on average over-estimated Remain in 2016. It is also possible that the change in opinion and vote intention across the campaign in 2017 was so dramatic that observers and some forecasting methods failed to update adequately in line with new information from the polls in time. In truth, we will never know.
Details of our methodology and links to component forecasts from our final combined forecast for 2017 are here.