
by John Curtice and Stephen Fisher, 4th May 2022.
Much of the speculation about what might happen in the English local elections tomorrow has focused on how many seats each party could or should gain or lose. Indeed, we can expect many a judgement to be cast on Friday on the basis of this evidence. However, given that these elections are held under first past the post (and in London multi-member plurality), seats won and lost can be a poor guide to how well a party has done in the ballot box. A party whose vote has fallen less than that of their principal rivals may gain seats even though it has lost votes. A third party whose vote is geographically spread may make a substantial advance in votes yet reap little reward in terms of seats. Meanwhile, even if these issues do not arise, seats won and lost only provide an indication of whether a party has lost or gained ground as compared with when the seats up for grabs were last contested – which this year, as is usually the case, was four years ago.
Yet we cannot simply add up votes cast either (even if we had the resource to collect them all on election night). In England (unlike Scotland and Wales) it is never the case that the whole country votes in local elections at the same time. The places that vote one year are politically different from those that vote in another. Given all these limitations, a key indicator of party performance that has come to be part of the ritual of local election night is the calculation of a ‘projected national share’ (PNS). This is an estimate of the share of the vote that the principal parties would have won in a GB-wide general election if voters across the country as a whole had behaved in the same way as those who actually voted in the local elections that year in England. It provides a single, seemingly straightforward measure of party performance that can tell us not only how well or badly a party has done as compared with four years ago, but also as compared with any previous local elections for which a PNS is available – even though the places in which local elections are held varies considerably from one year to the next.
Yet almost inevitably answering such a ‘what if’ question is not as straightforward as it might seem. Given the large number of wards being contested, the calculation of the PNS has to be made on the basis of a sub-sample of the local contests. None of the parties fight all of the wards being contested, and some may well fight fewer wards than others. At the same time, local election results in England tell us nothing about the performance of the nationalist parties in Scotland and in Wales. Any estimate of the PNS is affected by the decisions that are made about how best to address these issues. It is thus not surprising that there have often been some differences between the PNS that we have calculated for the BBC at previous local elections and that calculated by the local election experts, Colin Rallings and Michael Thrasher of Plymouth University, whose National Equivalent Vote (NEV) appears each year in The Sunday Times.
Those differences are typically limited with neither the PNS or NEV consistently better for any party. But since 2015 there has been a tendency for the PNS to be higher for Liberal Democrats and Others, and correspondingly lower for the Conservative and Labour than the NEV series. This can be seen in the table below.
| NEV: | PNS: | Diff: | ||||||||||
| Con | Lab | LD | Other | Con | Lab | LD | Other | Con | Lab | LD | Oth | |
| 2013 | 26 | 29 | 14 | 31 | 25 | 29 | 14 | 32 | -1 | 0 | 0 | +1 |
| 2014 | 30 | 31 | 11 | 28 | 29 | 31 | 13 | 27 | -1 | 0 | +2 | -1 |
| 2015 | 36 | 31 | 10 | 23 | 35 | 29 | 11 | 25 | -1 | -2 | +1 | +2 |
| 2016 | 32 | 33 | 14 | 21 | 30 | 31 | 15 | 24 | -2 | -2 | +1 | +3 |
| 2017 | 39 | 28 | 18 | 15 | 37 | 28 | 18 | 17 | -2 | 0 | 0 | +2 |
| 2018 | 37 | 36 | 14 | 13 | 35 | 35 | 16 | 14 | -2 | -1 | +2 | +1 |
| 2019 | 31 | 31 | 17 | 21 | 28 | 28 | 19 | 25 | -3 | -3 | +2 | +4 |
| 2021 | 40 | 30 | 15 | 15 | 36 | 29 | 17 | 18 | -4 | -1 | +2 | +3 |
It is not entirely clear why these gaps have emerged. Here we aim to explain some of the key features of the PNS methodology that might help explain the difference. In doing so, our aim is not to suggest that one approach is better than another, but rather to explain some of the decisions we have made that can have an impact on the figures we publish.
One key anchor in the construction of any estimate of a projected national vote comes from those occasions when general and local elections take place on the same day, a co-occurrence that last happened in 2015. Dual elections enable comparison to be made at the constituency level between the voting in the two kinds of elections and the difference between the parties’ performance in the two provides the projected national vote share for that year. But in addition, and crucially, it also provides a robust baseline against which we can apply the estimated change in party support in subsequent local elections in order to calculate a PNS.
However, the 2015 election witnessed a substantial increase in SNP and decline in Labour support north of the border (a change that has not been significantly reversed since). As we discussed in our 2016 blog post on the PNS, our approach to constructing the 2015 estimate means that this change became incorporated into our subsequent estimates. The effect has been to reduce Labour’s projected national share by some 2% of the GB vote, with a compensating increase in the estimated share of Others. This may help explain why since 2015 the PNS estimate of the Labour share has been lower than that from the NEV by an average of 1.5 points, while support for Others has been around 2.5 points higher.
One of the differences between a parliamentary election and local elections is that whereas in the former the Conservatives, Labour and the Liberal Democrats fight all or nearly all constituencies, the parties do not routinely contest every ward. This is particularly true of the Liberal Democrats, while the proportion they do fight varies from year to year. For example, the party contested 84% of wards up for election in 2010 but just 78% when the same set of elections was contested in 2018. Meanwhile, in 2015 the party fought just 54% of wards contested, but the proportion rose to 61% when the same set of council elections came around again.
Given that our aim is to estimate what the outcome of a hypothetical general election would be, it seems reasonable to assume that all three parties would contest most seats. Our PNS estimate is therefore based on what happens in those wards that all three contested both in the current year and in the baseline one. Meanwhile, doing so also avoids the risk that our estimate for a party is affected by the (varying) proportion of wards that it contests. This may help explain why our estimate of Liberal Democrat performance tends to be higher than that produced by the NEV (except for those years (such as 2013 and 2017) when county council elections are held, elections that typically are fought more systematically on a partisan basis).
One of the key features of British electoral behaviour since the EU referendum has been a substantial strengthening of the link between party support and whether people backed Leave or Remain. Leave voters – and Leave voting areas – have swung towards the Conservatives, while Remain supporters – and areas – have moved towards Labour. This pattern has also been reflected in local elections. Consequently, since the Brexit referendum it matters a lot whether the councils up for election are more on the Leave side or more on the Remain side. As we described in 2018 here, in 2019 here and in 2021 here, the regression and projection methodology we have developed in recent years accounts for both the different patterns of change in Leave and Remain areas, and the balance of Leave and Remain voting in local authorities across Britain.
In most rounds of local elections, the councils with elections are disproportionately Leave voting. (This is mainly because the more Leave voting English counties have a two-tier local government structure with either district or county council elections every year. London by contrast is strongly Remain voting but only has borough elections every four years.) The PNS methodology has estimated the extent to which those places without local elections were less likely to swing to the Tories than those places with local elections. This has more often than not dampened the overall estimate of the Conservative vote in the PNS. This may help to explain why our recent estimate of Conservative support has been less than that of the NEV. However, it should be noted that because London is voting this year, the places with elections are more pro-Remain than the country as a whole, and so depending on the pattern of voting, our modelling this year might have the opposite effect.
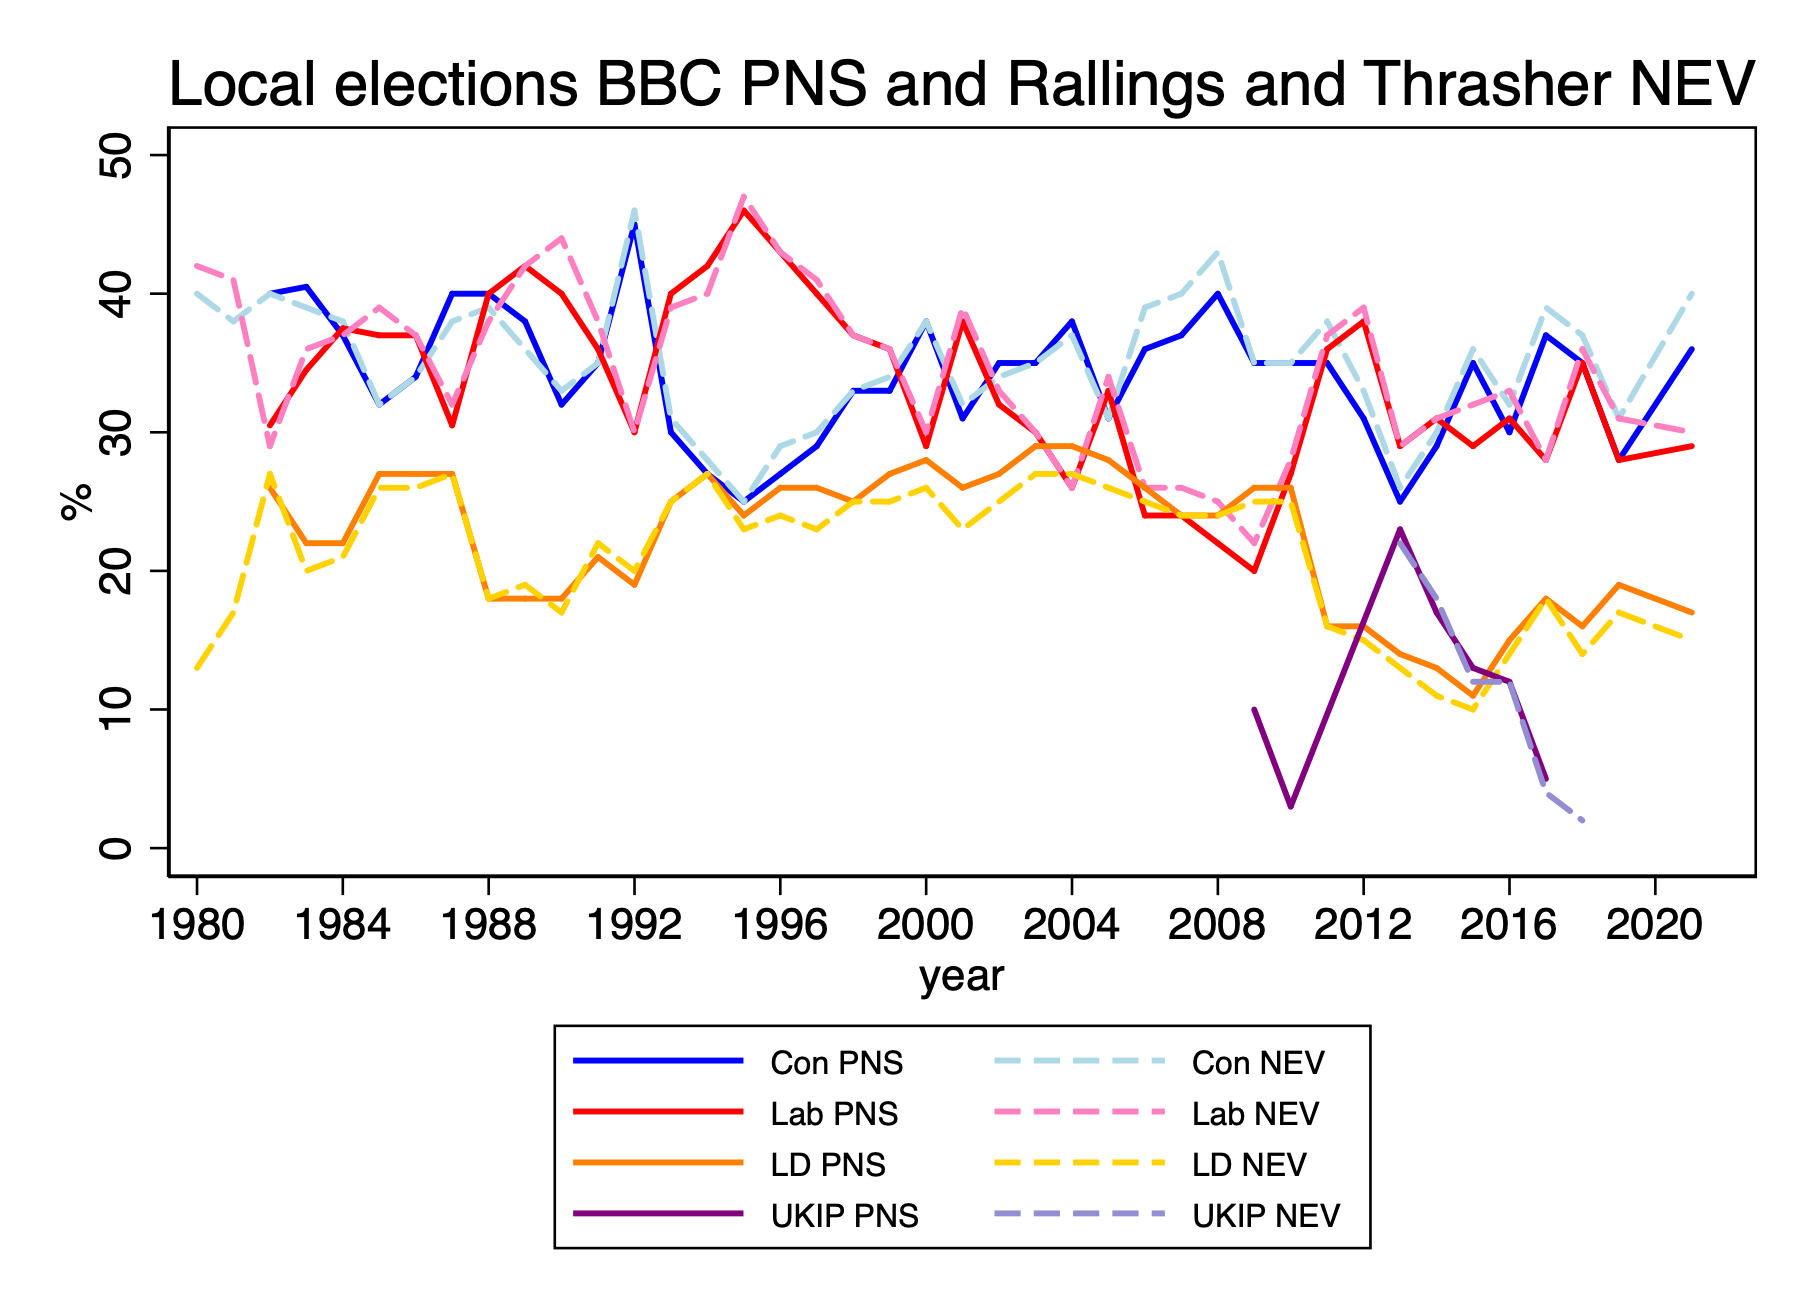
Much political attention on Friday will be on the relative performance of the Conservatives and Labour. Both the NEV and the PNS had the two main parties pretty much neck-and-neck in 2018. The key question is whether Labour can open up a sizable lead, as they have done in the opinion polls in recent months. To answer that, it will be safest to compare PNS estimates this year with previous PNS figures, and likewise this year’s NEV estimates with those for NEV in previous years. If the expectations of the opinion polls are fulfilled, that should be clear from both sets of figures.
The following graph shows the two series since 1980.
John Curtice is Professor of Politics at the University of Strathclyde.
Stephen Fisher is Professor of Political Sociology at the University of Oxford.
