
By Stephen Fisher, 2nd May 2023.
Changes in vote intention opinion polls typically provide an indication of headline net seat changes at local elections. This year presents a significant challenge to that idea.
Most of the seats up this year were last fought in 2019. The following table shows how party support in the opinion polls has changed since then.
Table 1. Opinion poll changes from 2019 locals to 2023 locals
| % | 2019 polls | 2023 polls | Change |
| Con | 29 | 29 | – |
| Lab | 33 | 44 | +11 |
| LD | 9 | 10 | +1 |
| Brexit+UKIP+Reform | 19 | 6 | -13 |
| Green | 5 | 5 | – |
With little net change for the Conservatives, Liberal Democrats or Greens, there has been a big swing from the parties which Nigel Farage once led (UKIP, Brexit and Reform) to Labour. We know from surveys that is not the product of much direct switching from Farage parties to Labour. Most of the support for UKIP and the Brexit Party from the spring of 2019 went to the Conservatives by the general election that year. Labour’s more recent rise of support has come disproportionately from 2019 Conservative-Remain voters, even though in absolute terms there have been more Conservative-Leave voters switching to Labour. Also, some of the Labour rise is apparently due to the decline in the numbers of people telling pollsters they know whom they would vote for.
Before thinking about how those general election vote changes might affect local elections this time, we need to reflect on a puzzle from last time. Back in 2019, the Farage parties did not stand many candidates. Many of their supporters must have turned up to the polls but had to look elsewhere for someone to vote for. That was perhaps part of the reason why independents and candidates for micro parties did so well that year. If so, then maybe the independents will do much less well this time now the Farage parties are less popular. But those independents and others who were elected in 2019 might since have built up personal support and benefit as first-term incumbents.
If the rise of Labour in the polls is, to an unusual extent, due to the rise of “Don’t Knows”, it might not translate to gains at the local elections. At around a third of the electorate, local election voters are more engaged and partisan. The rise of the “Don’t Knows” may have been more limited among those who normally vote in local elections. If so, the swing to Labour in the local elections might be smaller than what the polls suggest.
In addition to those unusual factors, there are the usual reasons why poll swings do not necessarily translate into local election outcomes, especially local politics and selective candidature.
Nonetheless, I have applied my usual local election seats forecasting models regardless. If nothing else it is interesting to consider the extent to which local election results do track opinion polls, and analysis of the discrepancies is instructive.
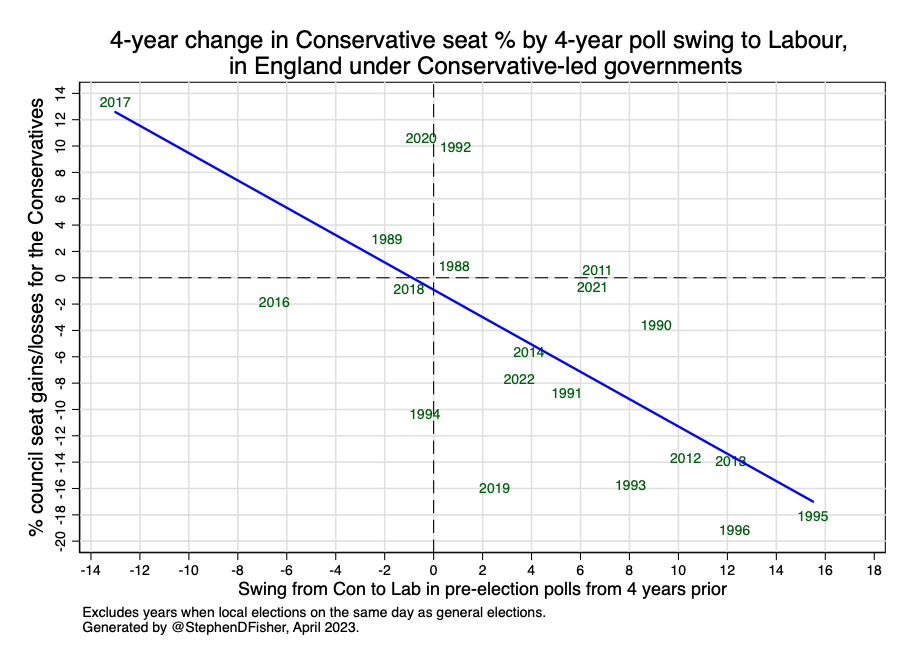
The graphs below show broadly how the models work. The table above implies a 5.5 point swing from Conservative to Labour. From that figure on the horizontal axis you can read up to the regression lines to find out roughly the percentage of the 8063 seats up the two main parties will win and lose.

Liberal Democrat local seat tallies at the national level depend primarily on the swing between them and the Conservatives. That is just 0.5 points to the Liberal Democrats this time.
Table 2 below shows the predictions from the regression models. Note that the figure for Others is just an accounting balance. The Conservative and Labour models are based on Con-Lab swing and the Lib Dem model is based on Con-LD swing. The three are estimated separately. They are not sensitive to the decline in the Other share. Hence the forecast rise in Other seats is more accidental than paradoxical.
Table 2. Forecasts for English local election net seat gains/losses for 2023
| Forecast | |
| Con | -490 |
| Lab | +400 |
| LD | +20 |
| Others | +70 |
There are various ways in which I think these forecasts may be wrong.
The Conservatives are defending a relatively low base from 2019. Not only did they suffer over a thousand net losses in 2019, they did so on very little swing against them from 2015 – as can be seen in the graph above. Given that the Conservatives seriously underperformed relative to the swing in 2019, it would be reasonable to expect the party to be more likely to over perform the model this year.
On the other hand, what Colin Rallings and Michael Thrasher said in their preview suggests the electoral system may work especially strongly against the Conservatives this time: “taking the likely previous outcome in newly drawn wards into account, a 6% swing from the Conservatives to Labour since 2019 could see Conservative seat losses breaching 1,000 with Labour registering 700 or so gains.” My macro models suggest a similar swing would yield less than half that number of Conservative losses. Since they have the data to take boundary changes and previous ward level vote shares into account, that comparison seems to imply the electoral system will exaggerate the swing against the Conservatives more than normal, as it did in 1995.
On that occasion tactical voting made things tougher still for the Tories. That too may happen this week. But in recent local elections tactical coordination between the Greens, Liberal Democrats and Labour has sometimes been more striking in its absence.
Even without coordination among opposition parties, the Conservatives might suffer from having to defend two different fronts. One in former Labour strongholds in the North and Midlands, and other against Liberal Democrat insurgency in the South. Both those opposition parties might make disproportionate gains by concentrating their efforts. For the Liberal Democrats, gains in the South might be compatible with little or no net increase in vote share, absolutely or relative to the Conservatives.
Unlike for the Conservatives, the Labour 2019 performance does fit the general pattern in the graph above. However, since Keir Starmer became leader Labour’s local election performance has been less good than the historical relationship between polls and local seats suggests it should have been. This was most striking for the seats which should have been contested in 2020 but were delayed because of covid, but also true for 2021 and 2022. If Labour under performs again this year it will raise questions for the model, but also for the party.
By contrast, the Liberal Democrats have tended to overperform the model since the coalition government ended in 2015. If that tendency continues this year, the Liberal Democrats should be more likely to make net gains of around +240 seats. Even though continued overperformance relative to the basic model seems reasonable this year, it cannot work forever. So I have declined to adjust the model in a way that implies the party will outperform the polls indefinitely.
Post-mortem for 2022 forecasts
The table below shows the forecasts from last year and the actual outcomes. The forecasts were not as accurate as could have been hoped for, but not too shabby either.
Table 3. Forecasts and actual local election net seat gains/losses for 2022
| England | Wales | Scotland | Overall | |||||
| Forecast | Actual | Forecast | Actual | Forecast | Actual | Forecast | Actual | |
| Con | -165 | -333 | -80 | -86 | -36 | -63 | -281 | -482 |
| Lab | +140 | +27 | +80 | +66 | +84 | +20 | +304 | +133 |
| LD | +70 | +178 | 0 | +10 | +6 | +20 | +76 | +208 |
| PC | 0 | -6 | 0 | -6 | ||||
| SNP | -24 | +22 | -24 | +22 |
