
By Stephen Fisher, John Kenny, Paul Furey, and Polina Ryzhuk. 12th June 2024.
All the different sources of seat forecasts still point to a large Labour majority. On average across the different kinds of forecast, the predicted majority is 192, down slightly from 197 last week. The Liberal Democrat forecast has crept up from 36 in our first forecast, to 37 last week, to 41 today. The betting markets are more optimistic for Reform UK winning seats than the poll-based models, as they were last week.
Table 1. Seat Forecasts
| Betting Markets | Complex models | Simple models | MRP | Average | |
| Con | 94 | 143 | 190 | 117 | 136 |
| Lab | 433 | 421 | 389 | 441 | 421 |
| LD | 46 | 41 | 32 | 45 | 41 |
| Reform | 3 | 1 | 0 | 1 | 1 |
| Green | 2 | 1 | 1 | 1 | 1 |
| SNP | 21 | 21 | 17 | 24 | 20 |
| PC | 2 | 3 | 3 | 3 | |
| Lab majority | 217 | 192 | 128 | 232 | 192 |
There are no new MRP seat estimates for More in Common, Survation, or YouGov models since last week. Electoral Calculus update theirs based on the average of all the polls, and essentially let the MRP estimates inform seat level variation around the headline share of the vote. So, the slight change in the MRP column in Table 1 is due to Electoral Calculus updates alone.
Figure 1 shows how the forecasts of the size of a Labour majority have changed since the start of the campaign. The downward trend for the complex models is largely due to the addition of new models over time. The betting markets seem to be increasingly convinced by the MRP forecasts.
Figure 1. Forecasts for the size of a Labour majority
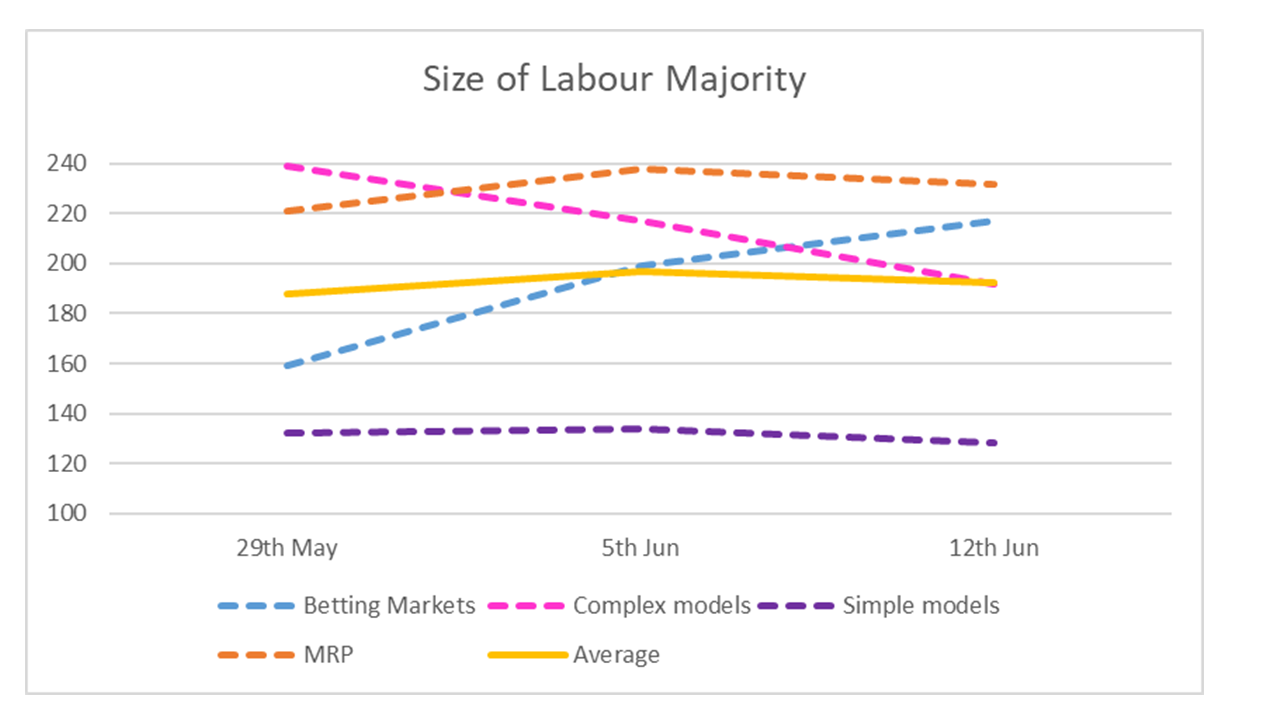
Table 2 shows estimates of probabilities and pseudo probabilities for different election outcomes. Averaging the different sources suggests a 94% chance of a Labour government and an 87% chance of a Labour majority. Practically no change since last week. Sadly, no new citizen forecast polls that we could find this week. We did take out two old ones (from early May), which made little difference.
Table 2. Probabilities (%)
| Betting markets | Models | Polls | Citizen forecast | Volunteered | Average | |
| Lab Majority | 95 | 95 | 100 | 59 | 87 | |
| Lab 100+ Majority | 76 | 76 | ||||
| Con led Gov | 5 | 0 | 14 | 0 | 5 | |
| Lab led Gov | 97 | 100 | 80 | 100 | 94 |
Figure 2 shows how stable the predicted probabilities of a Labour majority have been since the start of the campaign.
Figure 2. Predicted probabilities of a Labour majority
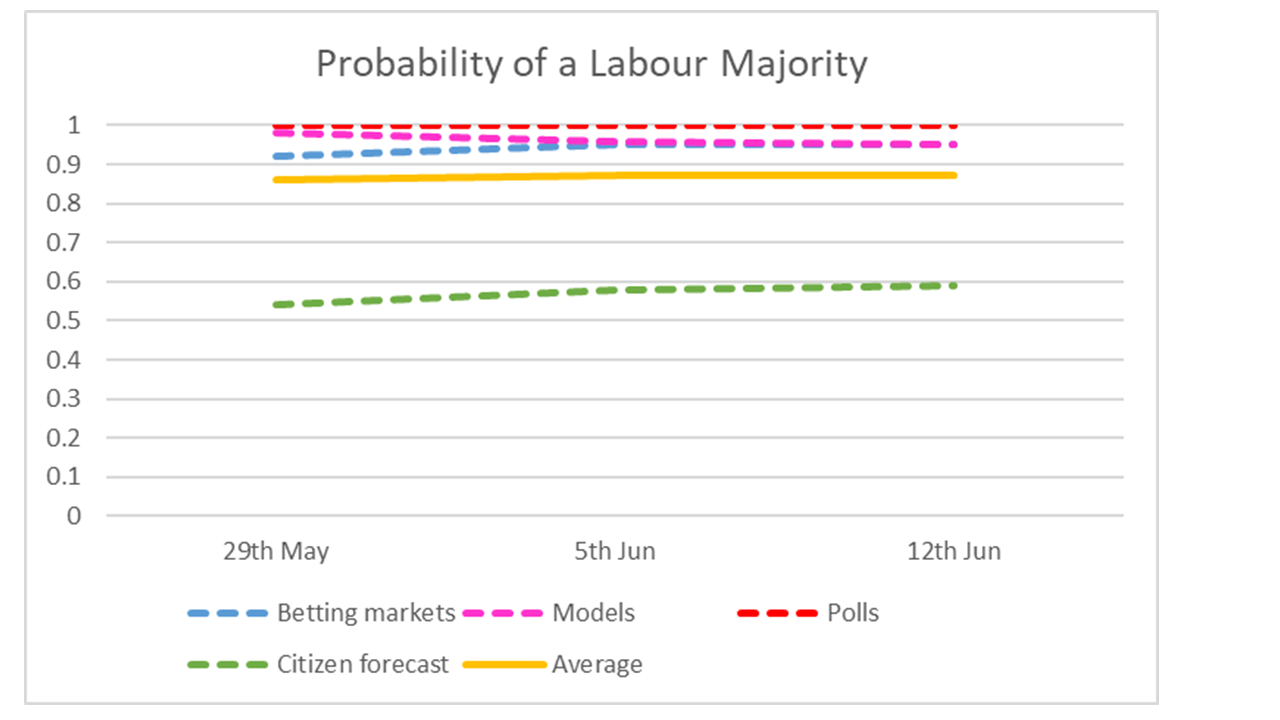
Table 3 summarises forecasts for vote shares. Again, very little change from last week. On average, Labour are forecast to have a 21-point lead over the Conservatives; no change since last week. Reform UK, however, are up 2 points in the polls and the non-MRP models, and up 3 points in the MRP models and the betting markets. The Conservatives and Labour are down one point each.
Table 3. Vote share forecasts (%GB except where stated)
| Poll aggregates | Betting markets | Models | MRP | Average | |
| Con | 23 | 22 | 22 | 24 | 22 |
| Lab | 43 | 42 | 43 | 42 | 43 |
| Lib Dem | 10 | 12 | 9 | 12 | 11 |
| Reform | 13 | 17 | 14 | 13 | 14 |
| Green | 6 | 6 | 6 | 6 | |
| SNP (Scotland) | 32 | 32 | 32 | ||
| PC (Wales only) | 14 | 11 | 12 | ||
| Lab-Con lead | 21 | 21 | 21 | 18 | 21 |
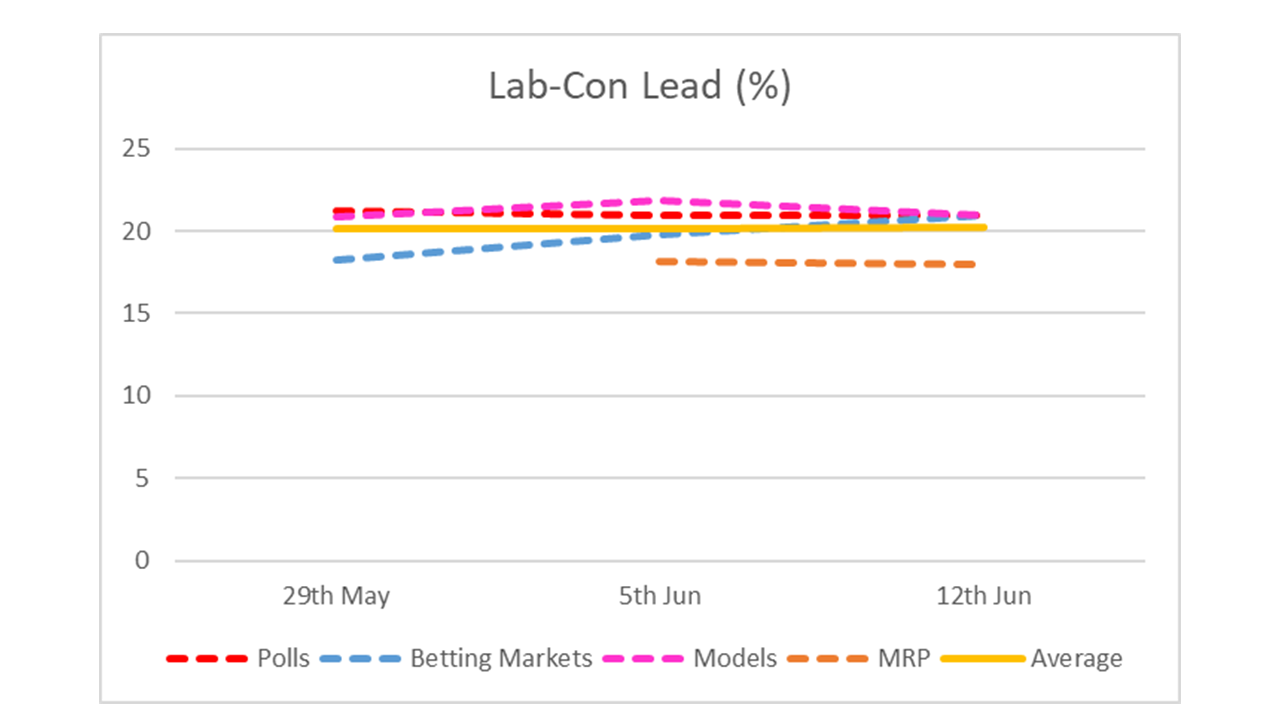
Figure 3 shows the forecasts for the Labour lead over the Conservatives in the GB share of the vote. The forecasts from the different sources have been remarkably stable and similar to each other.
Figure 3. Forecasts for the Labour lead in vote share
Estimates come from data collected late afternoon on 12th June 2024.
Methodology
The idea of combining forecasts from different sources has a good track record, though it has to be admitted that our attempts for the 2017 general election and the 2016 Brexit referendum did not work out so well. For reviews of previous combined forecasts here for 2017 and here for 2019. Also worth noting is the experience of the pollyvote.com combined forecast of the US presidential elections.
The basic approach is to combine forecasts by averaging them within each category and then average across categories. Since the different sources do not all present similar figures that can be averaged on a like-for-like basis there are various judgement calls we have had to make on how to treat the data.
Polls
For vote shares, we use the various available polling averages. Some admittedly are quite sophisticated, allowing for house effects, but they are nonetheless estimates of current public opinion and not future votes.
To estimate a pseudo-probability of a Labour majority from the polls, we take the proportion of pollsters with a GB Labour lead greater than 12 points, on the basis that this is the level required for a Labour majority under traditional uniform change assumptions. Similarly, the proportion of the most recent polls from each pollster with a lead of 19 points or more serves as a pseudo probability for the chances of a Labour majority of over 100 (making allowances for current polling in Scotland and Wales).
Statistical models
We have divided statistical models into simple (poll average plus uniform swing seats projections), Multilevel Regression and Poststratification (MRP), and other complex models (anything more elaborate than uniform change but not necessarily particularly complex). Within these categories we simply average the available estimates of seats and shares. We have not excluded any models based on quality, but they do have to be statistical models as opposed to personal guesses.
Betting markets
For the seats forecasts we are using the mid points of the spread betting for the markets. The markets might collectively imply fewer or more seats forecast for the parties in total than there are seats to be won in Britain. This is because the markets are separate for each party and do not need to be consistent collectively.
Betting markets for shares of the vote are typically done in bands. We take the mid points of the bands with the highest implied probabilities weighted by their implied probabilities from the betting odds. We then average across bookies.
Citizen forecasts
Some polls ask people what they think that the outcome of the election will be. We call these ‘citizen forecasts.’ Different pollsters use different survey questions but they can be combined to generate pseudo-probabilities. We use the proportion of poll respondents who think there will be a Labour majority, excluding “don’t knows” and re-percentaging, as the pseudo-probability of a Labour majority. We treat the question of whether Rishi Sunak will continue as prime minister to be equivalent to the Conservatives getting a majority, because they do not have any clear governing partners in the event of a hung parliament. Where appropriate, the probability of a Labour led government is taken to be 100 minus the probability of a Conservative led one. But that is not the case for questions where respondents are given the chance to say they think there will be some “other” kind of government. We use the most recent poll with a citizen forecast survey question from each pollster and only those in recent weeks. Only a few pollsters ask citizen forecast questions.
Volunteered forecasts
These come from the Good Judgement Project, which encourages people to forecast the outcomes of various events in order to develop and improve their forecasting skills. The people providing their predictions to the Good Judgement Project are not necessarily experts, but nor can they be seen as a representative sample, and so we report their predictions separately as ‘volunteered’ forecasts.
Sources:
Betting Markets:
Models (Elaborate):
New Statesman (Britain Predicts)
PM and Pendulum: Lebo and Norpoth
Models (MRP):
Models (simple):
Authors’ own uniform change projections with England, Scotland and Wales separate. Change in England taken from the average of the most recent GB vote intention poll from each pollster.
Poll Aggregates:
Authors’ own aggregations
Volunteered:
Citizen Forecasts:
