
By Stephen Fisher, John Kenny, Paul Furey, and Polina Ryzhuk. 3rd July 2024.
10am, 4th July. Updated to correct a minor typo. Forecasts published since the post below was published late last night but before polling stations opened this morning (and any we missed) will be incorporated in the evaluation after the results. So far it looks like those additions would make little difference to the tables below. Thanks to all the forecasters for their contributions.
The average of different kinds of seats forecasts points to a Labour majority of 194 in tomorrow’s general election. Changes since last week are: Conservative +8, Labour -3, LD +4, Reform +1, SNP -2, and no change for the Greens and PC. Those changes are partly due to moves in the betting markets, perhaps in response to polls that improved for the Conservatives, and new complex models (listed in the sources section below). However, MRP projections have worsened for the Conservatives. They are now forecasting an average of just 85 seats for the party.
Table 1. Seat Forecasts
| Betting Markets | Complex models | Simple models | MRP | Average | |
| Con | 107 | 124 | 206 | 85 | 131 |
| Lab | 434 | 424 | 369 | 460 | 422 |
| LD | 61 | 59 | 36 | 58 | 53 |
| Reform | 5 | 4 | 0 | 5 | 4 |
| Green | 2 | 2 | 1 | 2 | 2 |
| SNP | 18 | 22 | 17 | 17 | 18 |
| PC | 3 | 3 | 3 | 3 | 3 |
| Lab majority | 218 | 197 | 88 | 271 | 194 |
Table 2 below lists the latest MRP estimates. The variance between them continues to be remarkable, as well as the fact that none predicts a majority of less than 200.
Table 2. MRP seat forecasts
| Lab | Con | LD | Reform | Greens | SNP | PC | Majority | |
| Electoral Calculus | 470 | 61 | 71 | 7 | 3 | 15 | 3 | 290 |
| Find Out Now/Electoral Calculus | 450 | 60 | 71 | 18 | 4 | 24 | 4 | 250 |
| Focaldata | 444 | 108 | 57 | 2 | 1 | 15 | 2 | 238 |
| Ipsos | 453 | 115 | 38 | 3 | 3 | 15 | 4 | 256 |
| More in Common | 430 | 126 | 52 | 2 | 1 | 16 | 2 | 210 |
| Savanta | 516 | 53 | 50 | 0 | 0 | 8 | 4 | 382 |
| Survation | 484 | 64 | 61 | 7 | 3 | 10 | 3 | 318 |
| We Think / Economist | 465 | 76 | 52 | 3 | 3 | 29 | 3 | 280 |
| YouGov | 431 | 102 | 72 | 3 | 2 | 18 | 3 | 212 |
| Average | 460 | 85 | 58 | 5 | 2 | 17 | 3 | 268 |
Figure 1 shows how the forecasts of the size of a Labour majority have changed since the start of the campaign.
Figure 1. Forecasts for the size of a Labour majority
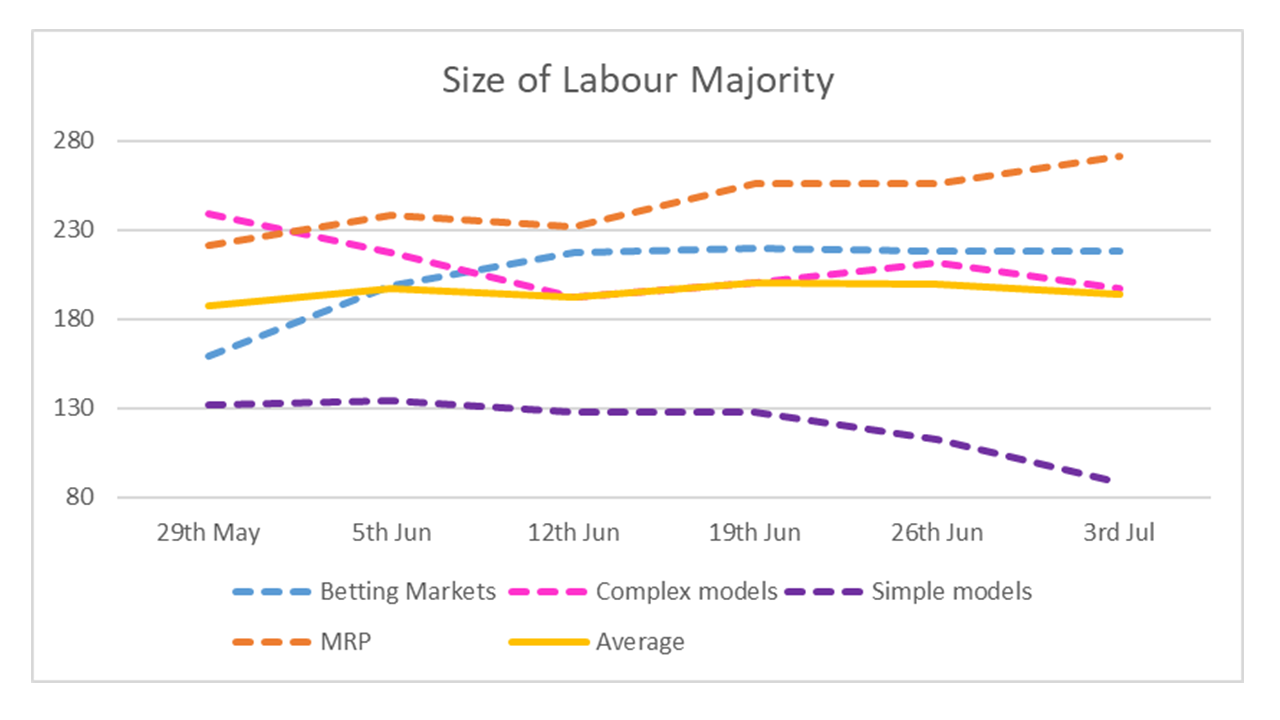
Table 3 shows estimates of probabilities and pseudo probabilities for different election outcomes. Averaging the different sources suggests a 95% chance of a Labour government and an 93% chance of a Labour majority. While the former figure is unchanged from last week, the latter is the product of some small changes and a new volunteered forecast.
Table 3. Probabilities (%)
| Betting markets | Models | Polls | Citizen forecast | Volunteered | Average | |
| Lab Majority | 98 | 97 | 100 | 81 | 92 | 93 |
| Lab 100+ Majority | 44 | 44 | ||||
| Con led Gov | 2 | 0 | 18 | 0 | 5 | |
| Lab led Gov | 99 | 100 | 82 | 100 | 95 |
Figure 2 shows how stable the predicted probabilities of a Labour majority have been since the start of the campaign. The remarkable movement in the citizen forecasts have been partly due to different combinations of polls being available.
Figure 2. Predicted probabilities of a Labour majority
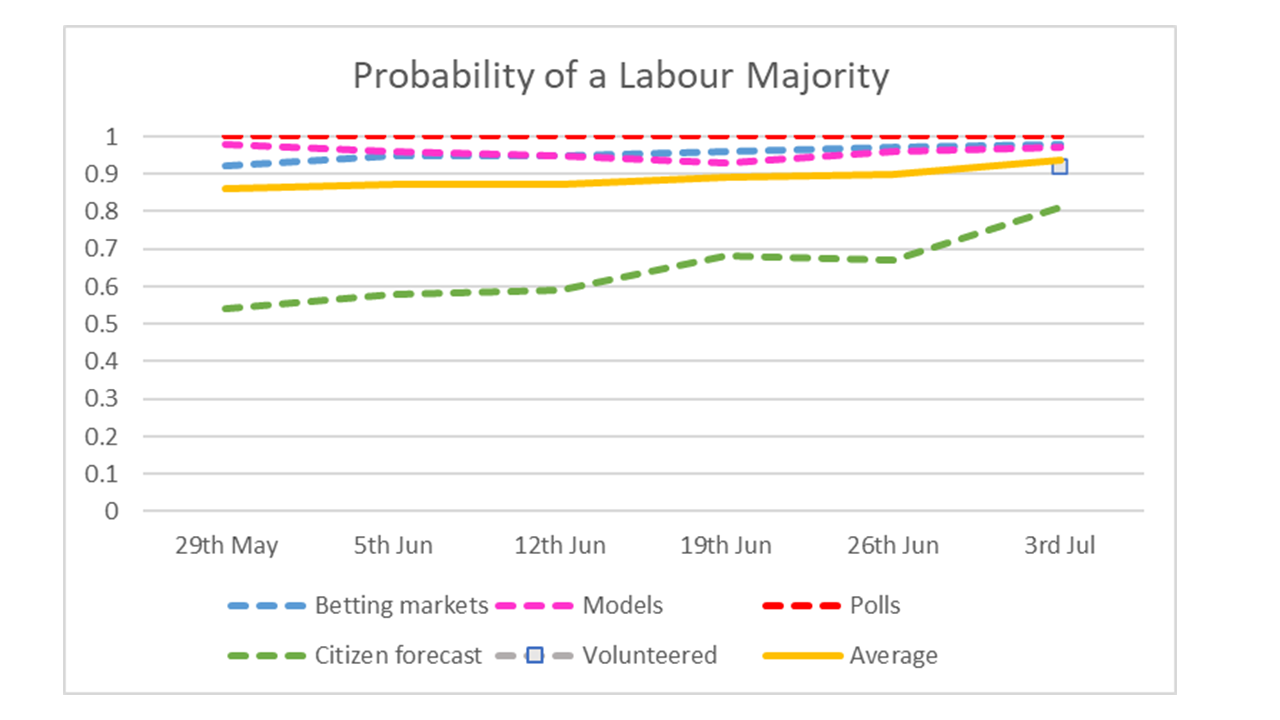
Table 4 summarises forecasts for vote shares. The Conservatives are up one point and Labour are down one point this week. The Labour lead has therefore dropped from 20 to 18 points. No changes for other parties except the SNP, where the change is due to the addition of a betting market expectation that the SNP will outperform the polls.
Table 4. Vote share forecasts (%GB except where stated)
| Poll aggregates | Betting markets | Models | MRP | Average | |
| Con | 21 | 22 | 22 | 23 | 22 |
| Lab | 40 | 39 | 39 | 41 | 40 |
| Lib Dem | 11 | 13 | 11 | 11 | 12 |
| Reform | 16 | 17 | 16 | 14 | 16 |
| Green | 6 | 6 | 6 | 6 | |
| SNP (Scotland) | 31 | 39 | 33 | 35 | |
| PC (Wales only) | 14 | 12 | 13 | ||
| Lab-Con lead | 19 | 18 | 17 | 18 | 18 |
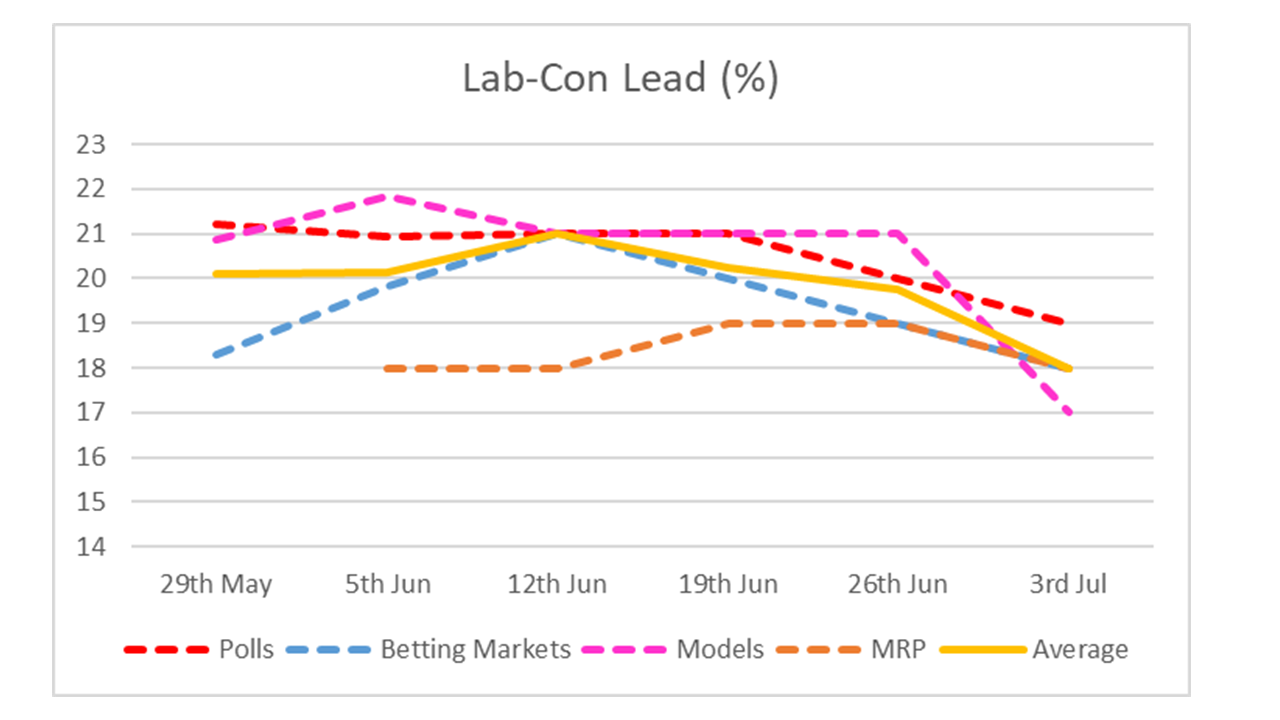
Figure 3 shows the forecasts for the Labour lead over the Conservatives in the GB share of the vote. There has been a notable downturn in the last week. But an average lead of 18 points is still very strong.
Figure 3. Forecasts for the Labour lead in vote share
Estimates come from data collected late on 3rd July 2024.
Methodology
The idea of combining forecasts from different sources has a good track record, though it has to be admitted that our attempts for the 2017 general election and the 2016 Brexit referendum did not work out so well. For reviews of previous combined forecasts here for 2017 and here for 2019. Also worth noting is the experience of the pollyvote.com combined forecast of the US presidential elections.
The basic approach is to combine forecasts by averaging them within each category and then average across categories. Since the different sources do not all present similar figures that can be averaged on a like-for-like basis there are various judgement calls we have had to make on how to treat the data.
Polls
For vote shares, we use the various available polling averages. Some admittedly are quite sophisticated, allowing for house effects, but they are nonetheless estimates of current public opinion and not future votes.
To estimate a pseudo-probability of a Labour majority from the polls, we take the proportion of pollsters with a GB Labour lead greater than 12 points, on the basis that this is the level required for a Labour majority under traditional uniform change assumptions. Similarly, the proportion of the most recent polls from each pollster with a lead of 19 points or more serves as a pseudo probability for the chances of a Labour majority of over 100 (making allowances for current polling in Scotland and Wales).
Statistical models
We have divided statistical models into simple (poll average plus uniform swing seats projections), Multilevel Regression and Poststratification (MRP), and other complex models (anything more elaborate than uniform change but not necessarily particularly complex). Within these categories we simply average the available estimates of seats and shares. We have not excluded any models based on quality, but they do have to be statistical models as opposed to personal guesses.
Betting markets
For the seats forecasts we are using the mid points of the spread betting for the markets. The markets might collectively imply fewer or more seats forecast for the parties in total than there are seats to be won in Britain. This is because the markets are separate for each party and do not need to be consistent collectively.
Betting markets for shares of the vote are typically done in bands. We take the mid points of the bands with the highest implied probabilities weighted by their implied probabilities from the betting odds. We then average across bookies.
Citizen forecasts
Some polls ask people what they think that the outcome of the election will be. We call these ‘citizen forecasts.’ Different pollsters use different survey questions but they can be combined to generate pseudo-probabilities. We use the proportion of poll respondents who think there will be a Labour majority, excluding “don’t knows” and re-percentaging, as the pseudo-probability of a Labour majority. We treat the question of whether Rishi Sunak will continue as prime minister to be equivalent to the Conservatives getting a majority, because they do not have any clear governing partners in the event of a hung parliament. Where appropriate, the probability of a Labour led government is taken to be 100 minus the probability of a Conservative led one. But that is not the case for questions where respondents are given the chance to say they think there will be some “other” kind of government. We use the most recent poll with a citizen forecast survey question from each pollster and only those in recent weeks. Only a few pollsters ask citizen forecast questions.
Volunteered forecasts
These come from the Good Judgement Project, which encourages people to forecast the outcomes of various events in order to develop and improve their forecasting skills. The people providing their predictions to the Good Judgement Project are not necessarily experts, but nor can they be seen as a representative sample, and so we report their predictions separately as ‘volunteered’ forecasts.
Sources:
Betting Markets:
Models (Elaborate):
New Statesman (Britain Predicts)
PM and Pendulum: Lebo and Norpoth
Models (MRP):
We Think/Economist
Models (simple):
Authors’ own uniform change projections with England, Scotland and Wales separate. Change in England taken from the average of the most recent GB vote intention poll from each pollster.
Poll Aggregates:
Authors’ own aggregations
Volunteered:
Citizen Forecasts:
