By Stephen Fisher
Vote-intention opinion polls provided a rough guide to council seat net gains and losses last year. Reform, Greens and the Liberal Democrats were up in the polls, compared with four-years prior, and so made gains. Reform were up most in the polls and also made the biggest gains. Conversely, the Conservatives were down in the polls more than Labour were, and correspondingly lost more seats than Labour did.
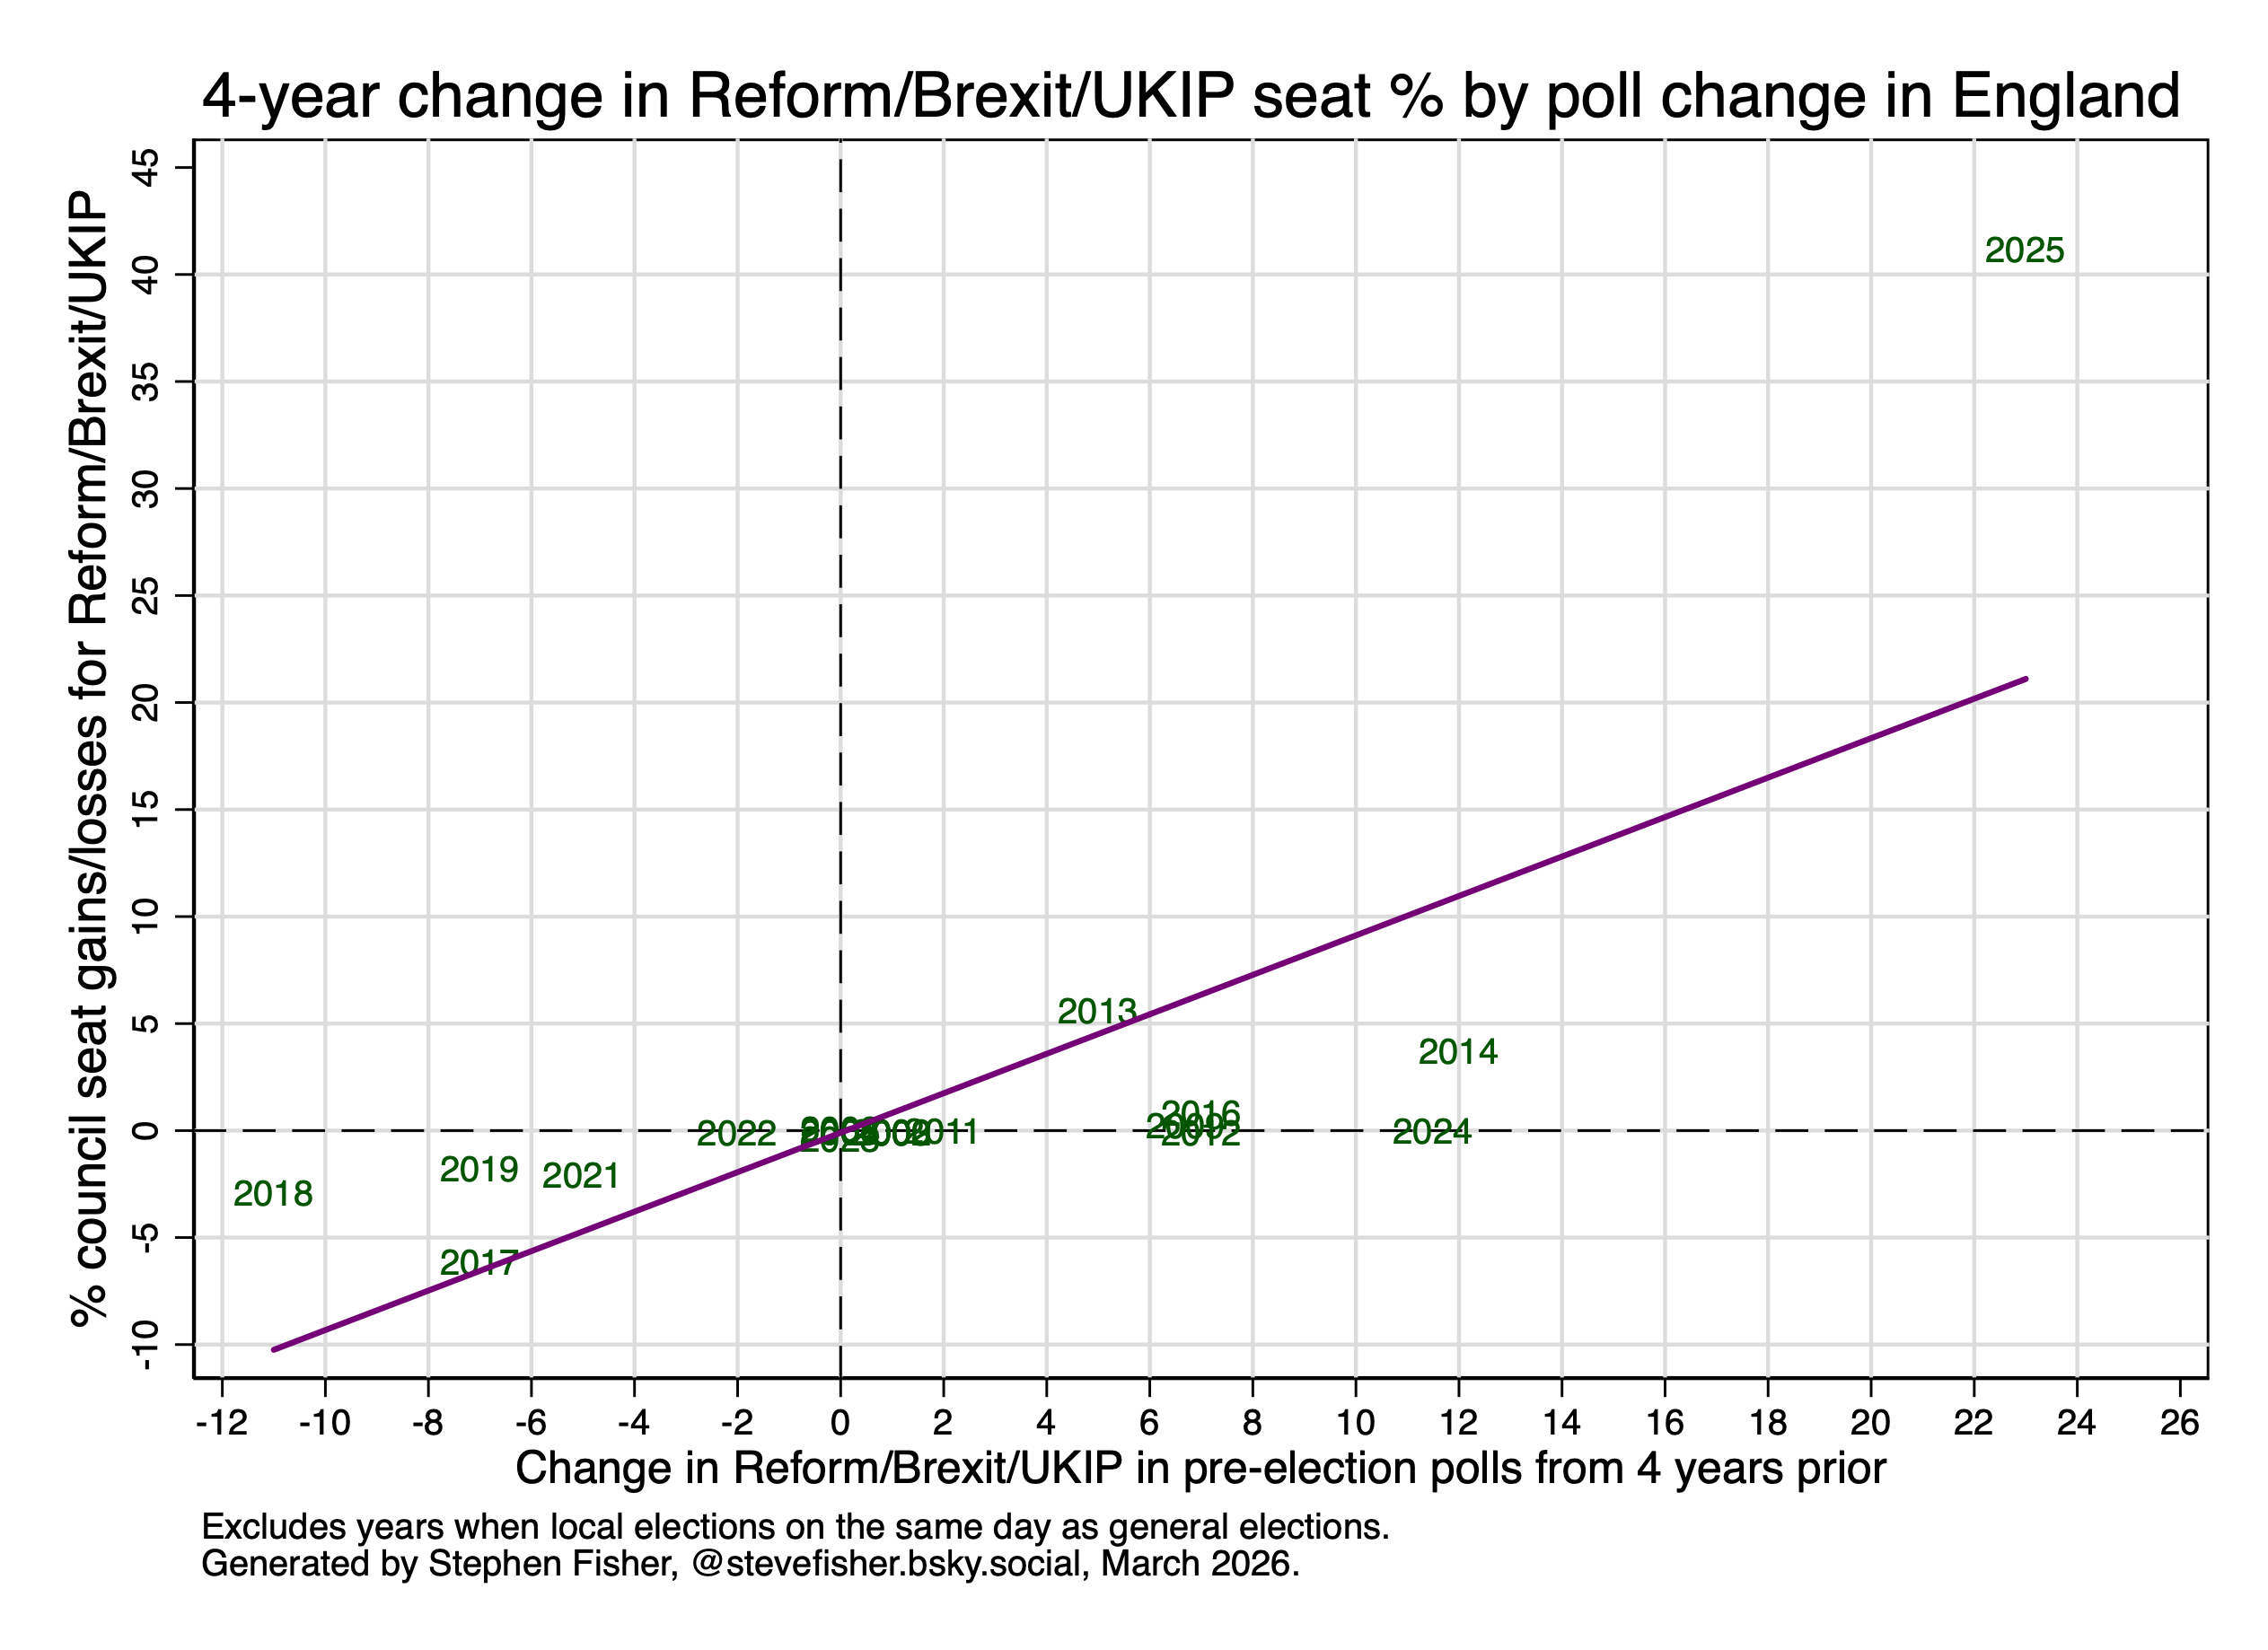
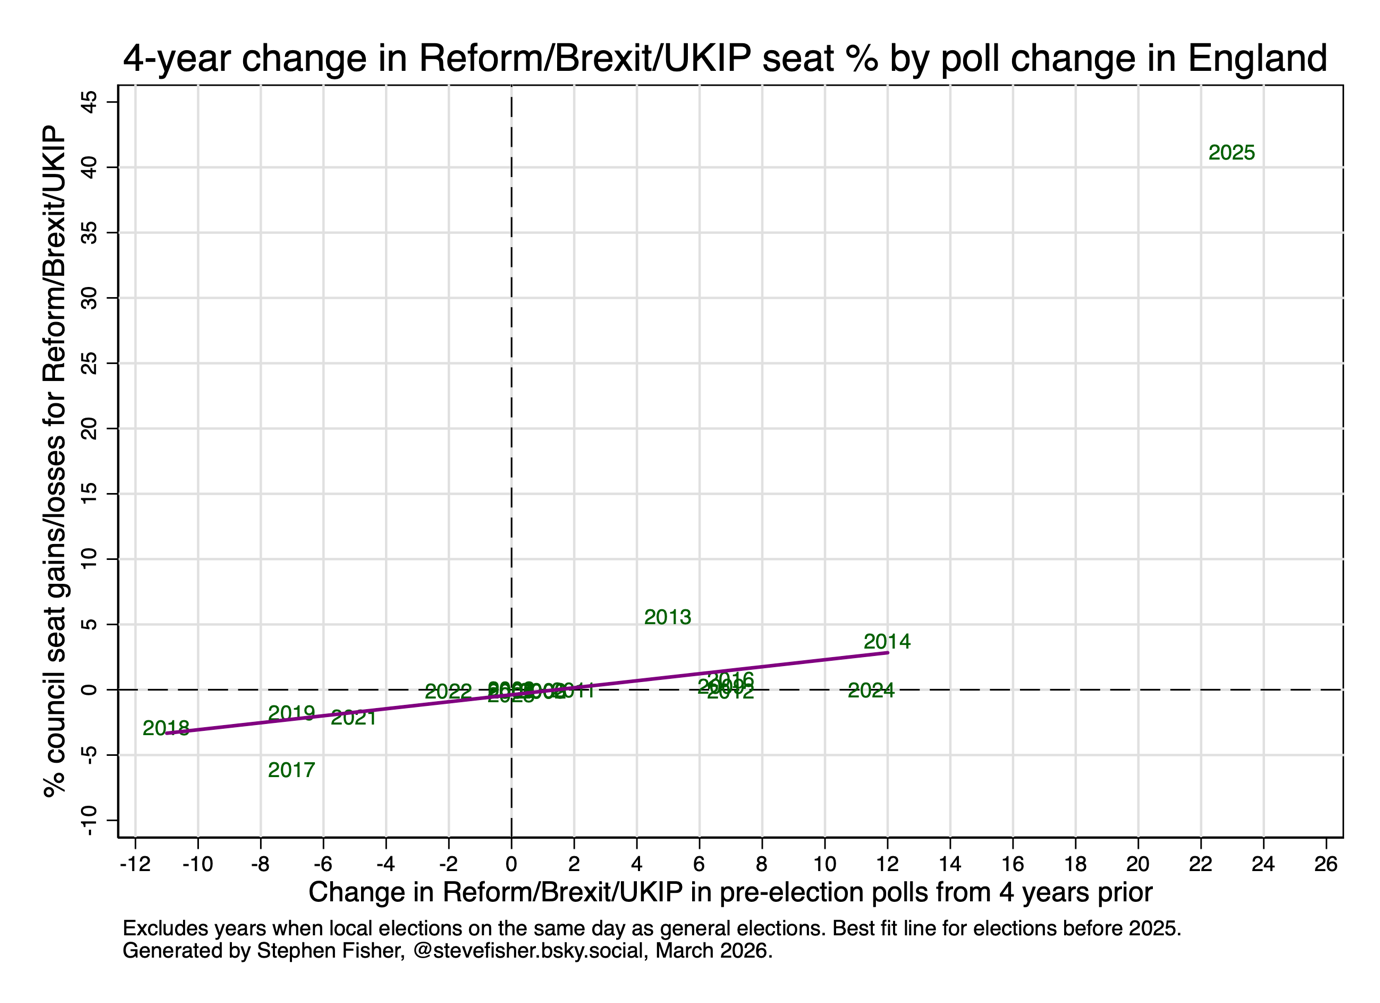
But while the direction of change was the same in the local elections as it was in the polls, the scale of the Reform gains and corresponding Conservative losses was extraordinary. The graph below shows what an enormous outlier the Reform performance was relative to the pattern up to 2024.
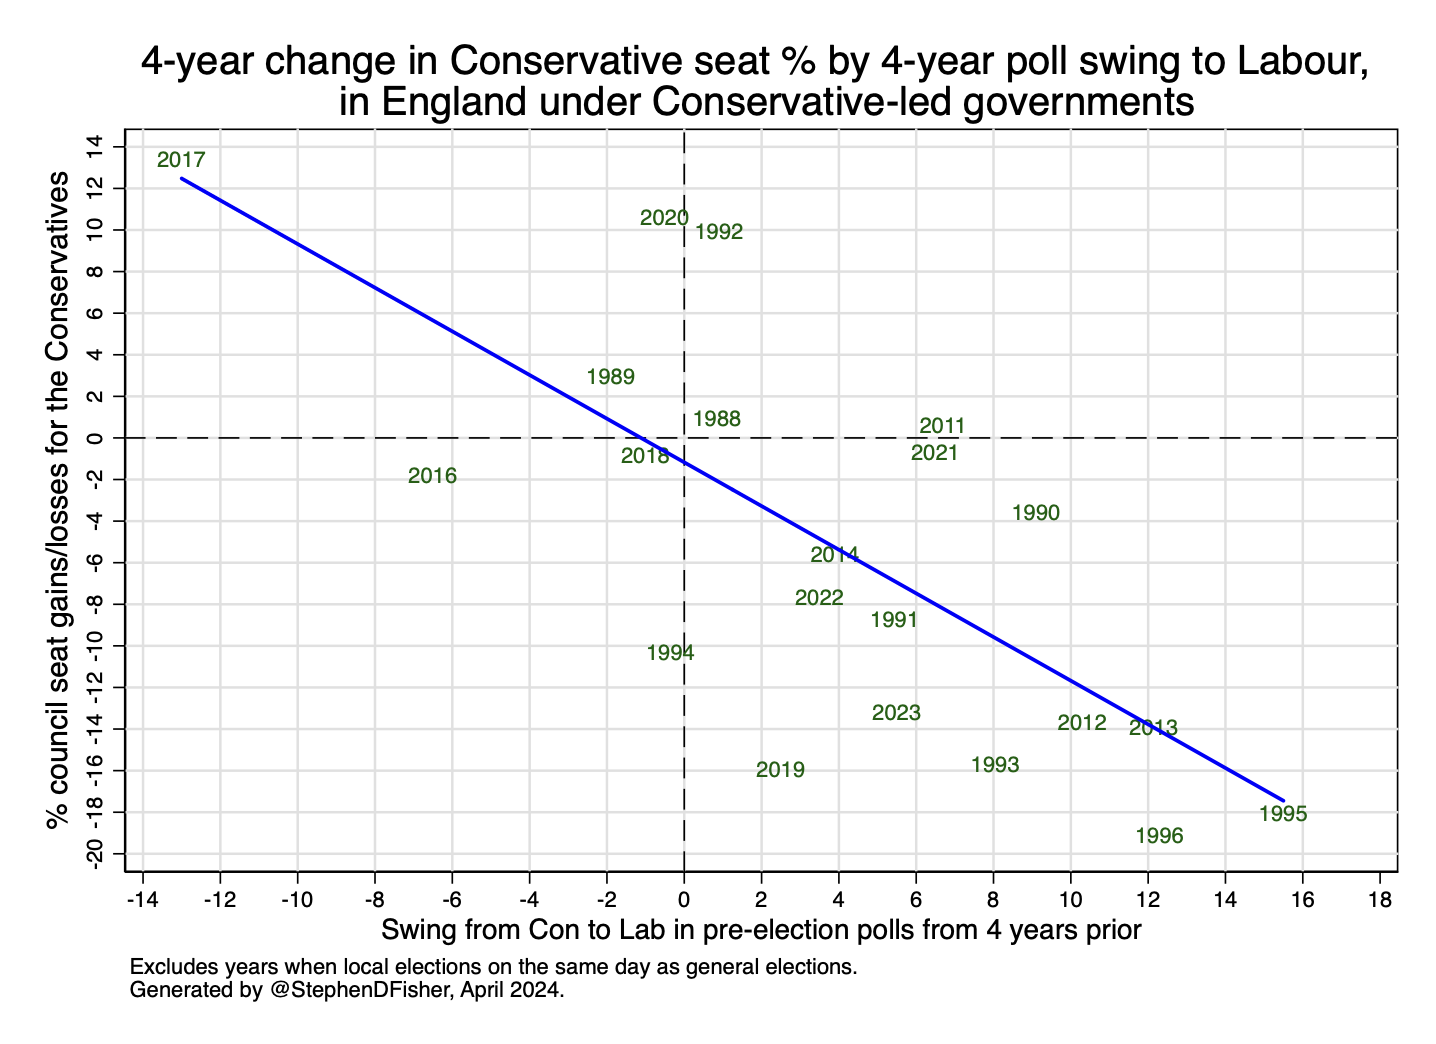
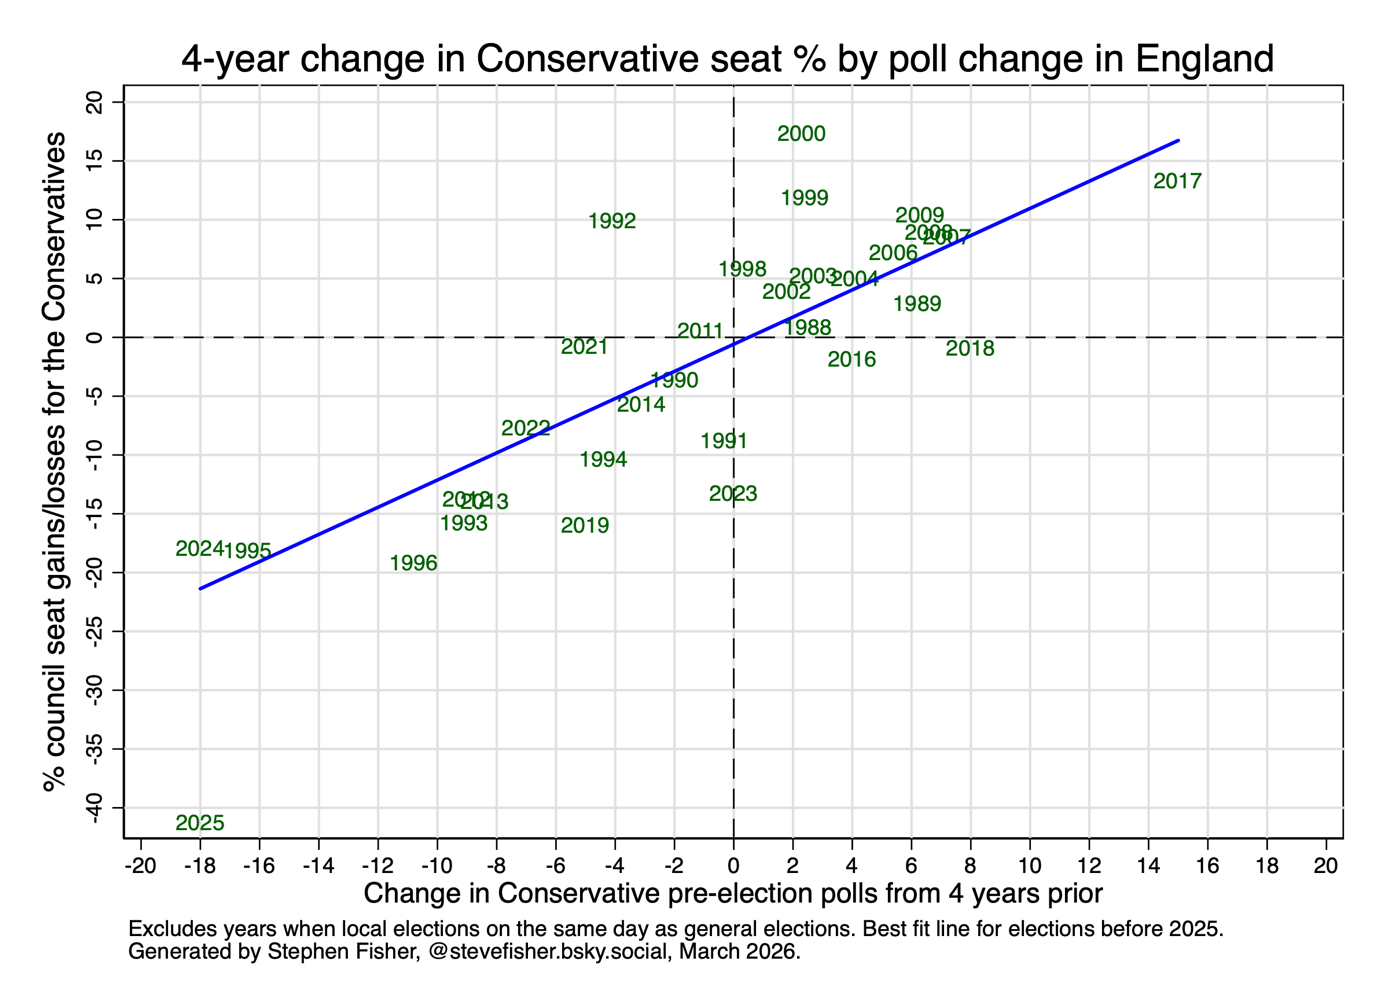
The following graph shows that 2025 was also a clear outlier for the Conservatives.
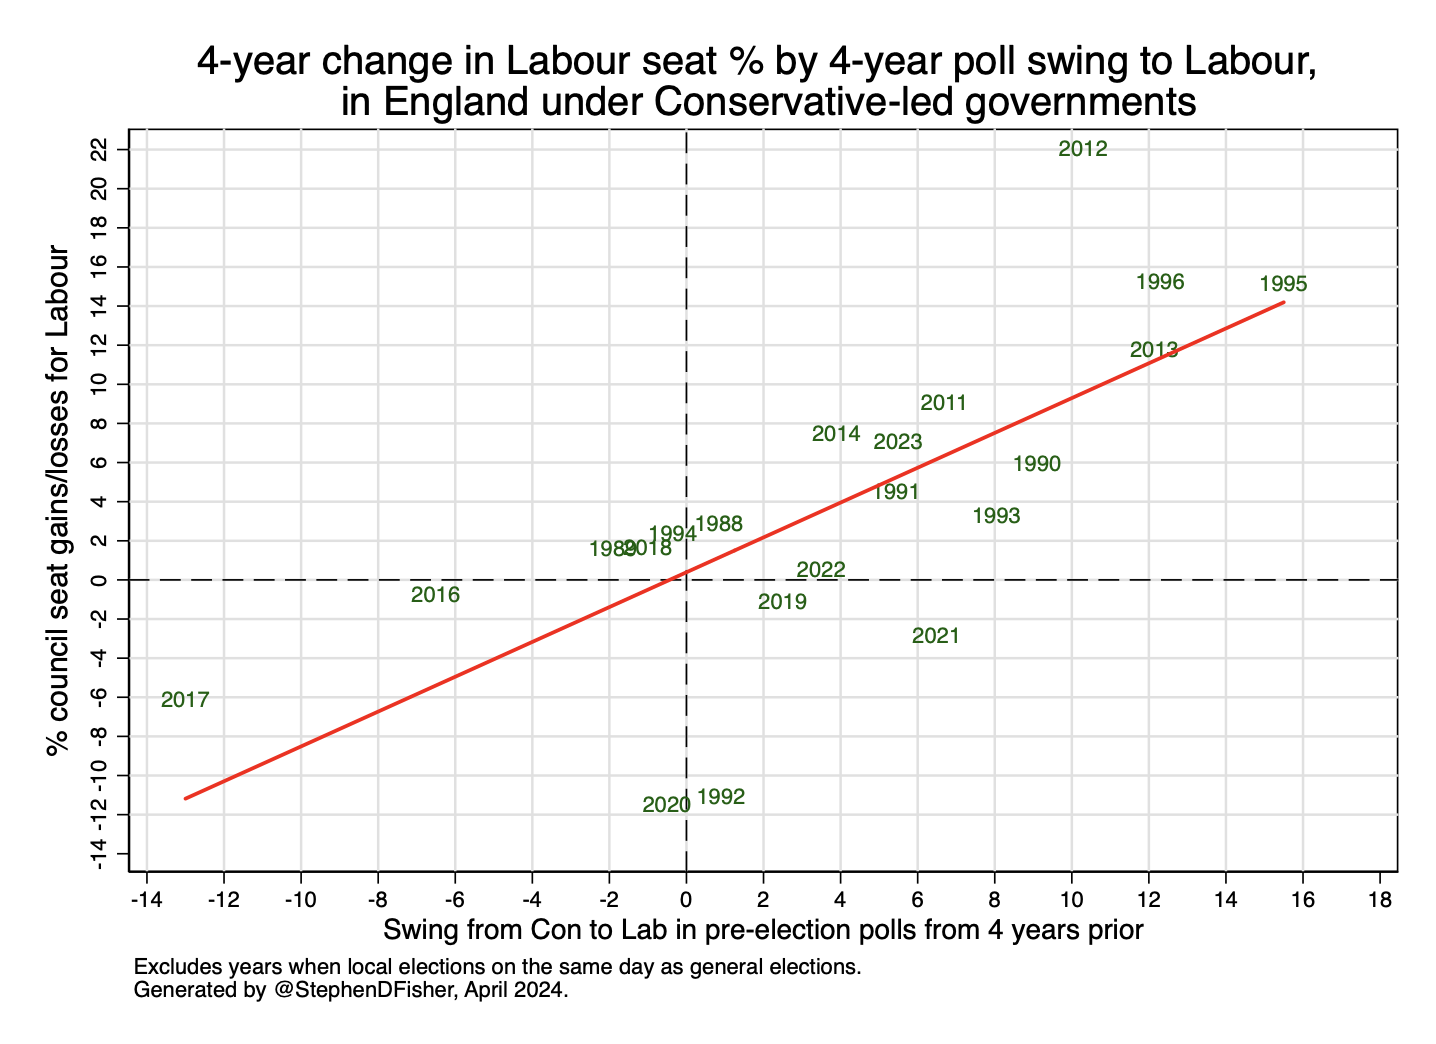
For Labour, the Liberal Democrats and the Greens, the net gains and losses were broadly in line with expectations based on previous elections, as the following graphs show.
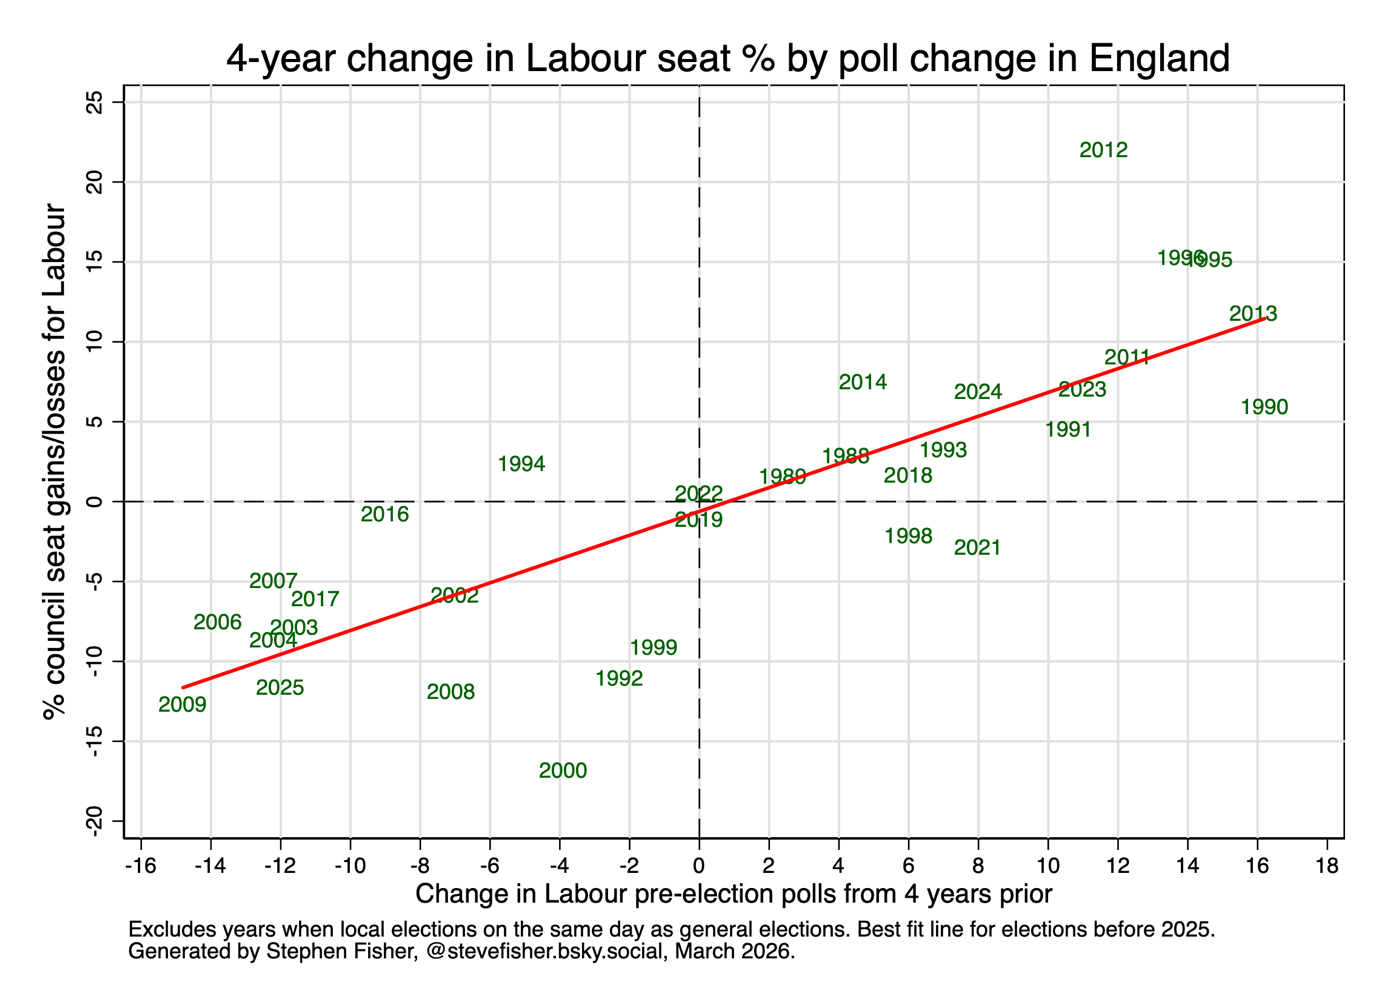
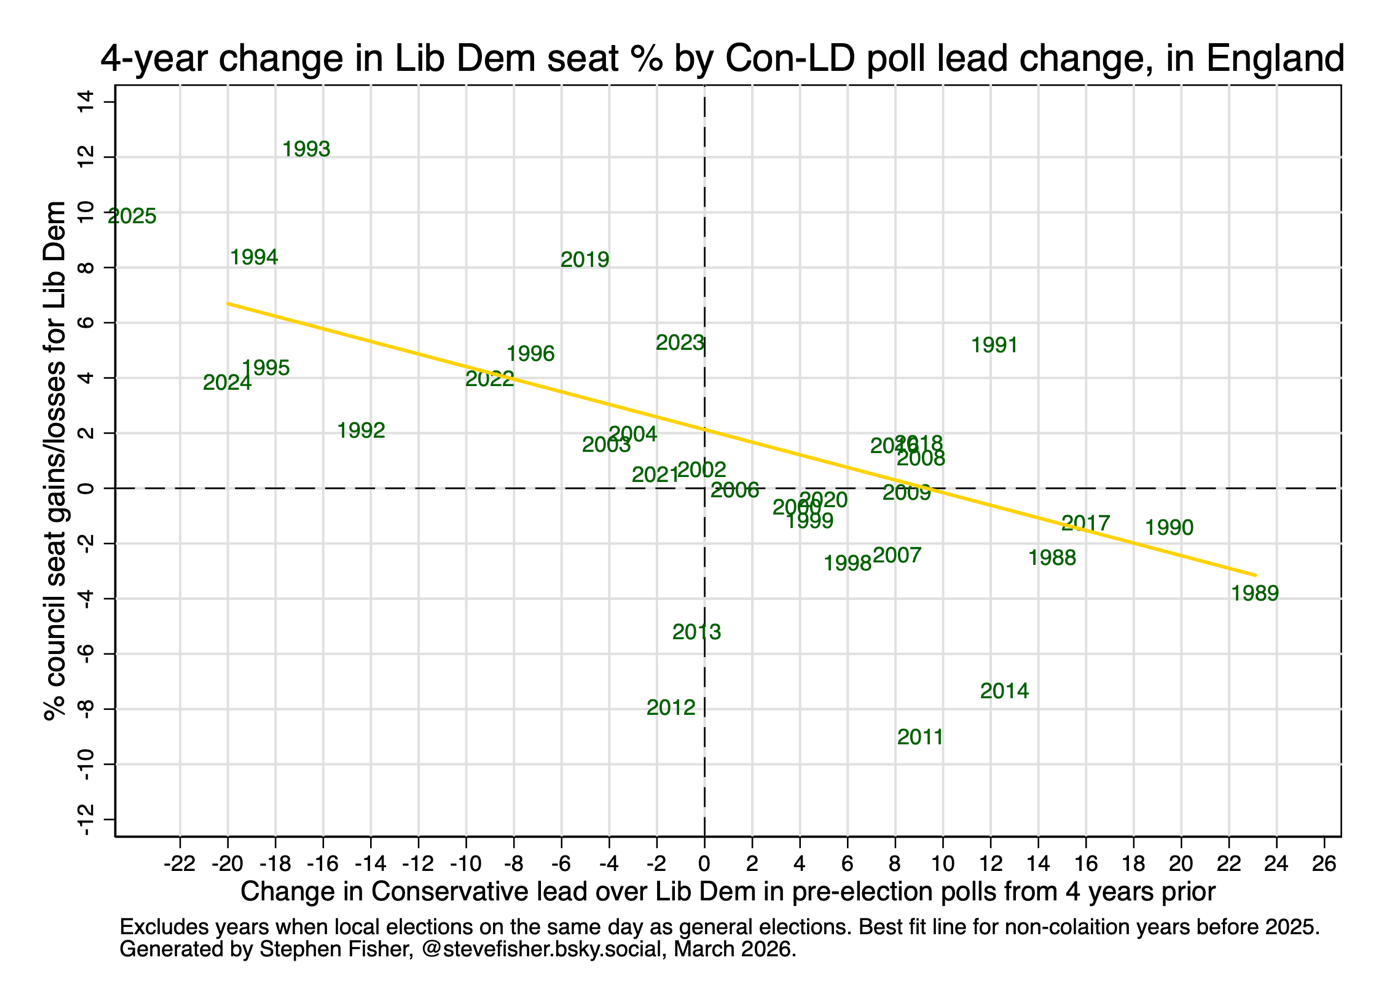
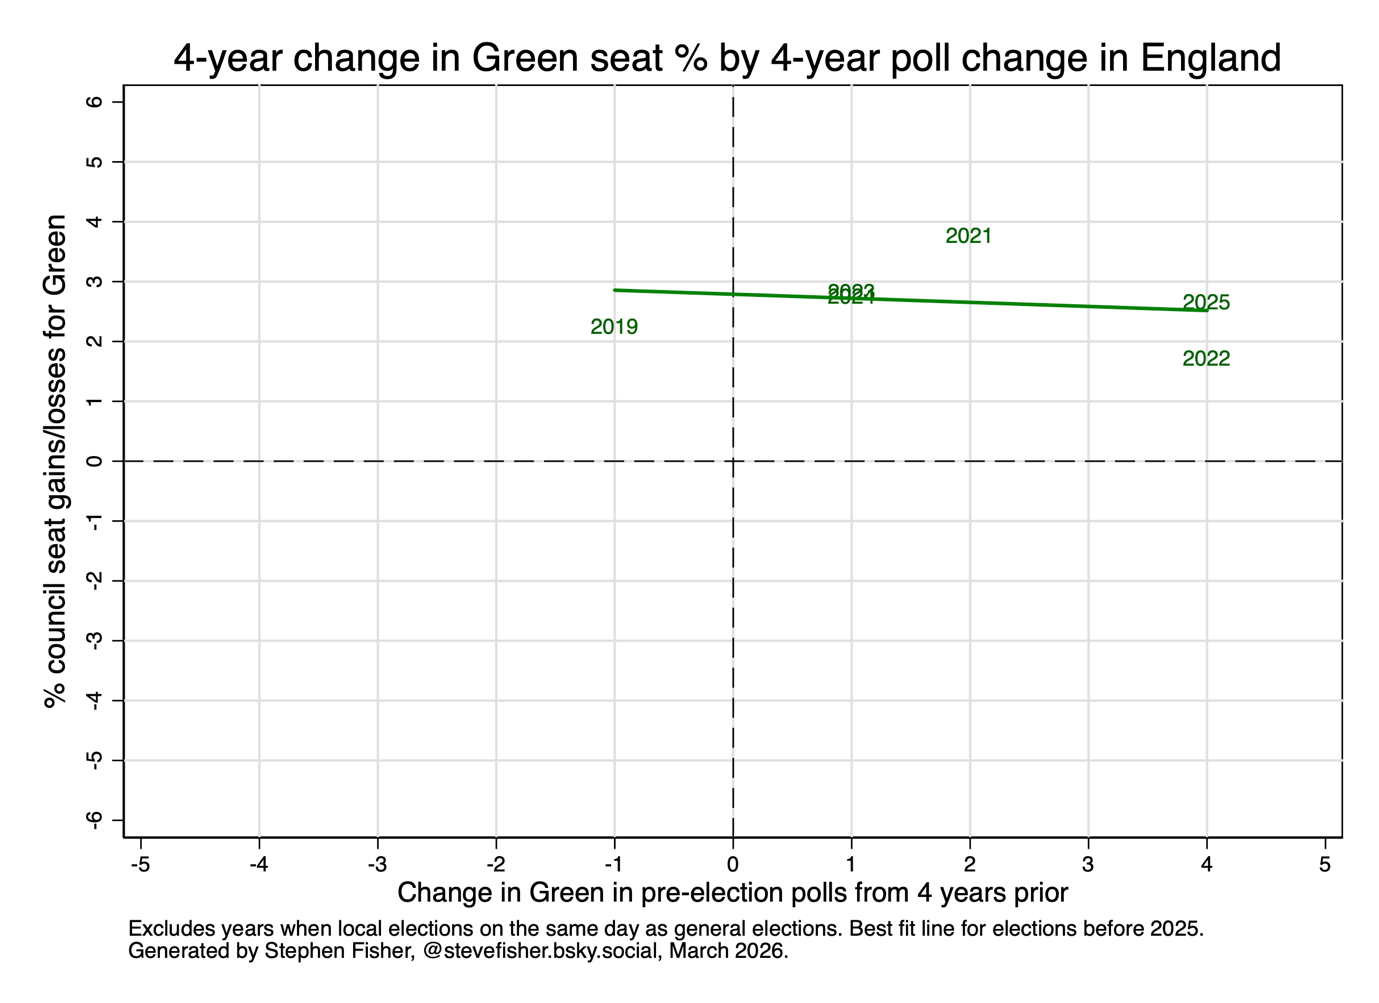
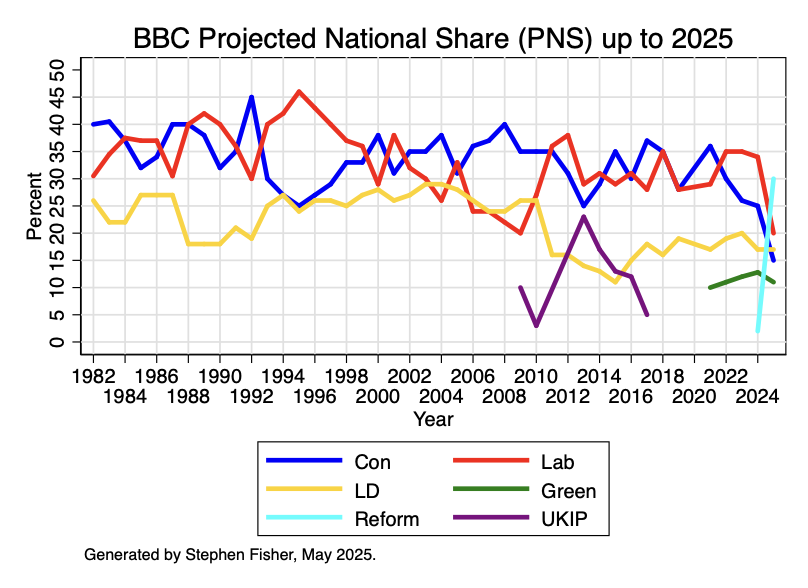
Table 1 shows how party support in the opinion polls has changed since 2022 when most of the seats up this year were last fought. The 2026 figures are the average of the most recent poll from each of eleven pollsters that were conducted within the last month. The table also includes the corresponding figures used last year. The broad situation is the same: Reform up by over 20 points; Conservatives and Labour down heavily; and the Liberal Democrats and Greens also up from four-years prior.
Table 1. Opinion poll changes from 2021 to 2025, and 2022 to 2026 locals (GB)
| % | 2021 | 2025 | Change 21-25 | 2022 | 2026 | Change 22-26 |
| Con | 41 | 23 | -18 | 34 | 18 | -16 |
| Lab | 36 | 24 | -12 | 40 | 19 | -21 |
| LD | 7 | 13 | +6 | 10 | 12 | +2 |
| Green | 5 | 9 | +4 | 6 | 15 | +9 |
| Reform | 2 | 25 | +23 | 2 | 27 | +25 |
On that basis, the broad pattern of seat gains and losses is likely to be similar to last year: big gains for Reform; more modest gains for the Greens and the Liberal Democrats; and heavy losses for the Conservatives and Labour.
Local Seat Projections
My projections for local election seat gains and losses for the May 2026 round of local elections are in Table 2. With over five thousand seats up and a lot of change in public opinion since 2022, some of the projected gains and losses are huge. They imply a net movement of nearly three thousand council seats from the two traditionally largest parties to the Greens, Liberal Democrats and especially Reform.
Table 2. Projections for net seat gains and losses at 2026 local elections
| Seat projections | |
| Con | -1010 |
| Lab | -1900 |
| LD | +200 |
| Green | +450 |
| Reform | +2260 |
The +200 net seat gains projected for the Liberal Democrats is the only projection based on a model I have used for several years: a regression of LD seat share change on Con-LD swing, with allowance for additional losses during the coalition years.
The projected +450 net gains for the Greens is based on the same method that worked reasonably well last year: an additional 1% of the seats up for every percentage point rise in the polls since four-years prior.
For the Conservatives and Reform, both the classic models and the method I used last year provide a poor fit for last year. Since this year has a high chance of having a broadly similar result to last year, a different approach is needed.
Reform will make +2260 net gains if they are able to translate their +25-point rise in the polls into council seats at the same rate as they translated their +23-point poll rise last year.
The knock-on consequences of three thousand projected net gains for Reform, Greens and Liberal Democrats combined are for the Conservatives and Labour collectively to suffer a net loss of 74.2% of the seats they are defending. The independents and minor parties may also lose seats, but since they are only defending 260 that will not alleviate much of the damage to the Conservatives and Labour.
The projected -1010 losses for the Conservatives and -1900 for Labour in Table 2 are based on the assumption that both parties suffer that same 74.2% loss of seats. That assumption is a compromise position. Since the Conservatives are down more heavily than Labour in the polls we might expect the Conservatives to lose seats at a greater rate. On the other hand, Labour have been losing more heavily than the Conservatives in local by-elections since May.
If the Conservatives do lose -1010 seats net, they will be down to around 350, just 7% of the seats up. That is startlingly low, but still larger than the 6% of seats that Labour won last year.
The seats up this year are traditionally a strong set for Labour, not least because they are mainly in London and other Metropolitan borough councils. In 2022 Labour won just over half the seats up in England. If the projected -1900 losses is correct then Labour will win just 13% of the seats.
Local by-election gains and losses since May 2025 provide some reason to think that Reform may not do so well as polls and the pattern in last year’s big round of local elections would suggest. Reform have made +68 net gains in by-elections, representing 37.2% of the 183 seats up. If replicated this May, net gains of 37.2% would amount to +1865 seats. While that is well short of the +2260 projection in Table 2, it would still be record breaking.
On the same basis, the Conservatives will lose half their seats (-670) and Labour three-quarters (-1920) if local by-election loss rates over the last year are repeated this May.
Post-mortem for 2025 projections
The predictions from last year in Table 3 below are taken from Mark Pack’s helpful compilation. Given the graphs above, readers will not be surprised to see that my projections were reasonably good for Labour, the Liberal Democrats and the Greens, but well out for the Conservatives and Reform.
Table 3. Forecasts and actual local election net seat gains/losses for 2025
| Britain Elects | Electoral Calculus | Politics UK | Robert Hayward | Sam Freedman | My projections | Actual | |
| Con | -538 | -471 | -545 | -475 to -525 | -500 to -600 | -350 | -675 |
| Lab | +72 | -32 | -183 | -25 to +25 | “Roughly” zero | -140 | -189 |
| LD | +104 | +68 | +203 | +70 to +80 | +50 to +150 | +75 | +163 |
| Green | +17 | -1 | +44 | +20 to +40 | “Small” gains | +65 | +44 |
| Reform | +311 | +474 | +522 | +400 to +450 | +350 to +500 | +375 | +677 |
| Others | -25 | +20 |
The Green and Reform projections were simply based on an additional 1% of the seats up for every extra percentage point increase in their poll rating since 2021. That worked reasonably well for the Greens but was not good enough for Reform. Others rightly anticipated greater gains, but all substantially underestimated Reform. While I thought my projection for Reform was a “reasonable benchmark,” given the polls at the time, there was no clear basis from the pattern of past local elections to predict any bigger gains for Reform.
I am glad I said, “I suspect that with 995 seats to defend, the Conservatives will lose more than 350.” However, I also said, “the model unwittingly projects Labour to lose nearly half their seats. That seems unlikely.” Labour actually lost nearly two-thirds of their seats.
Many thanks to Colin Rallings, Michael Thrasher, David Cowling, Rob Ford and the BBC for help compiling the data over the years.