by John Curtice and Stephen Fisher, 3rd May 2023.
Much of the speculation about what might happen in the English local elections this week has focused on how many seats each party could or should gain or lose. The Conservatives have seemingly accepted an analysis for the Local Government Chronicle that they could lose 1,000 seats – presumably in the hope that they will do better than that – while Labour have suggested they might win 400 – presumably anticipating they will gain rather more. We can expect many a judgement to be cast on Friday on the basis of this evidence.
However, given that these elections are held under single or multi-member plurality, seats won and lost can be a poor guide to how well a party has done in the ballot box. A party whose vote has fallen less than that of their principal rivals may gain seats even though it has lost votes. A third party whose vote is geographically spread may make a substantial advance in votes yet reap little reward in terms of seats. Meanwhile, seats won and lost only provide an indication of whether a party has lost or gained ground as compared with when the seats up for grabs were last contested.
These caveats are particularly important this year. Ninety per cent of the seats were last fought in May 2019, when Theresa May was Prime Minister and Jeremy Corbyn Leader of the Opposition, both of whom were rebuffed by voters in the local ballot boxes. In contrast, the Liberal Democrats and the Greens performed relatively well four years ago. Meanwhile, just over 5,000 of the 8,000 seats at stake are in relatively small shire district councils, where in most instances all of the seats are up for grabs in wards that elect more than one councillor at the same time. The outcome in these districts will dominate the headline numbers. Moreover, in many instances they are places where Labour is not competitive locally, and the scale of any Conservative losses will depend not on how well Labour do but, rather, on the performance of the Liberal Democrats.
Yet we cannot assess the party’s votes by simply adding up the votes cast (even if we had the resource to collect them all on election night). In England (unlike Scotland and Wales) it is never the case that the whole country votes in local elections at the same time. The places that vote one year are politically different from those that vote in another. For example, unlike last year, there are no elections in Labour-dominated London.
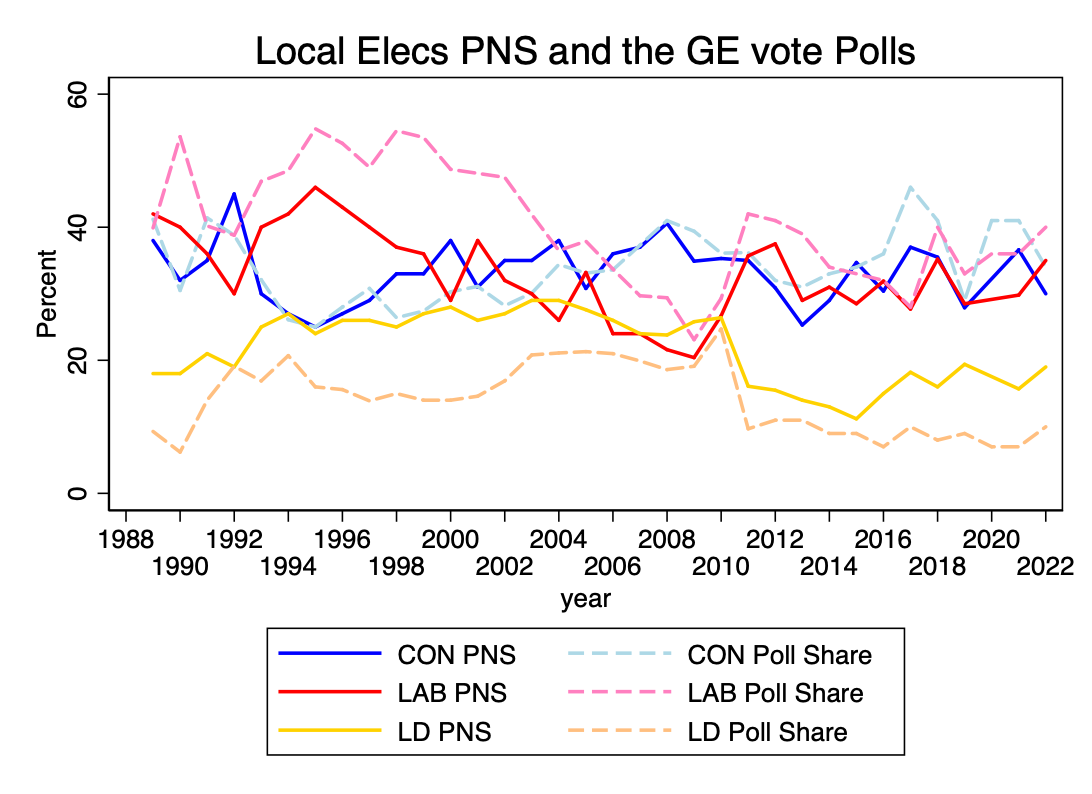
Given all these limitations, a key indicator of party performance that has come to be part of the ritual of local election night (or the following day) is the calculation of a ‘projected national share’ (PNS). This is an estimate of the share of the vote that the principal parties would have won if, across Britain as a whole, voters had behaved in the same way as those who did vote in the wards that were contested by all three principal parties in this year’s English local elections. It provides a single, seemingly straightforward measure of party performance that can tell us not only how well or badly a party has done as compared with four years ago, but also as compared with local elections over the last forty years – even though the places in which local elections are held varies considerably from one year to the next.
Yet almost inevitably answering such a ‘what if’ question is not as straightforward as it might seem. Given the large number of wards being contested, the calculation of the PNS has to be made on the basis of a sub-sample of the local contests. None of the parties fight all of the wards being contested, and some may well fight fewer wards than others. At the same time, local election results in England tell us nothing about the performance of the nationalist parties in Scotland and in Wales. Any estimate of the PNS is affected by the decisions that are made about how best to address these issues.
Continue reading Understanding the Local Elections Projected National Share (PNS) in 2023 →