Stephen Fisher, 24th October 2014
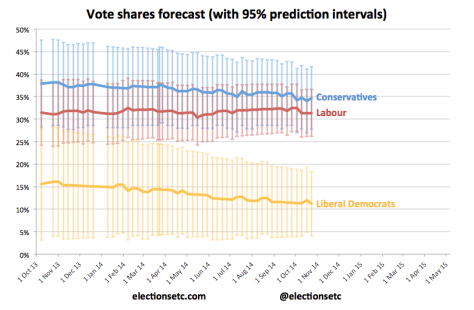
I first published a forecast of the 2015 general election result in October 2013. After taking on board comments and testing more candidate models, in February I revised the method from the one in this working paper to the one in this working paper. Both use opinion polls and election results going back to the 1950s to tell us what is likely to happen in this electoral cycle, and importantly, how sure we can be that it will happen. The historical pattern suggested governments tend to recover from mid-term blues while oppositions suffer a set back. Also the polls have tended to overestimate Labour and underestimate the Conservatives. Both factors suggested a Conservative lead at the next election. But also the variation in previous cycles was plenty enough to suggest very different outcomes were also possible if less likely.
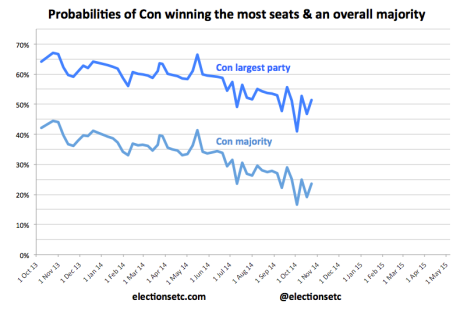
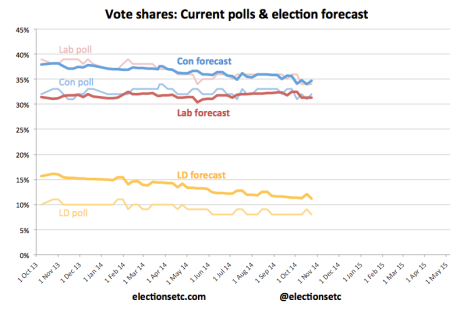
Using a polling average for 8th October 2013 of Conservatives 32%, Labour 39% and Liberal Democrats 10% the revised method suggested a 42% chance of a Conservative overall majority. Over the last year the probability of a Conservative majority dropped steadily to 24% now. Why?  Instead of making a 3-point recovery in the polls, as historical votes and polls suggest they should have done over the last year, the Tories have roughly been level pegging around 32%. The Liberal Democrats not only failed to make any recovery over the last year but have dropped by another couple of points. Only Labour has performed as expected, by losing five points in the polls. So while the forecast election Tory share has dropped from 38% to 35% that for Labour has remained around 31%.
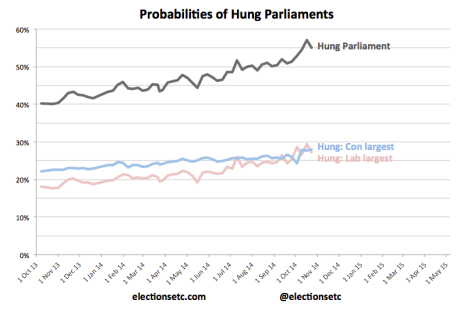
  With this narrowing of the forecast Conservative lead over Labour from 7 to 2 points and time for change running out, the chances of a hung parliament have increased from 40% a year ago to 55% now.
  The onward march of UKIP over the last year is both symptom and cause of the Conservative failure to recover. The former Conservative voters who defected to UKIP earlier in the electoral cycle are anxious about the economy and immigration. The economy has been improving overall but not much in the kinds of ways and places that help UKIP supporters who remain economically pessimistic. Similarly, the Tories have failed to deliver on promises to cut immigration.
But it should also be admitted that one of the reasons why the Tories have failed to win back defectors is effective wooing by UKIP. By comparison with five years ago, UKIP is a much more effective campaigning machine, its leader is more charismatic and its political strategy of emphasising immigration and linking it with the European Union has been much more powerful. UKIP have gone from 11% to 16% in the polls over the last year and along the way won the Euro elections, achieved stunning local election results and by-election performances and persuaded two MPs to defect to them. Perhaps what is remarkable is not that the Tories failed to recover lost ground, but that they did not cede more.
UKIP’s gains over the past year have come mainly at Labour’s expense. Indeed the best summary of the overall change in public opinion over the last year is a 5-point swing from Labour to UKIP. Whereas in YouGov polls a year ago the ratio of former Conservative to former Labour voters now intending to vote UKIP was greater than 3:1, now it is close to 2:1.
While UKIP is critical to understanding the changing levels of major party support in the polls, the risk for the forecasting method is not so much the overall strength of UKIP, which is factored in, but the prospect of differential performance across constituencies. The local and Euro elections in May showed us that UKIP’s performance is much more uneven now than it was in 2010 – enough that the uniform change assumptions in the model may go seriously awry. Also, the model has yet to allow for substantial seat gains for the SNP (mostly at Labour’s expense) that recent Scottish polls point to. What if any changes to the model should be made in response to these issues depends on further analysis that is still pending.
Despite these and a few other unresolved issues for the forecasting methodology, the past year has provided more reinforcing than undermining evidence for the main features of the method. The polls over-estimated Labour and underestimated the Tories at the Euro elections in much the same way that they have historically done at general elections and as the forecasting model expects.
Also, while party support in the polls has not changed perfectly in line with the historical average, it has been remarkably close. In fact, developments have been much closer than could reasonably have been expected given that none of the previous election cycles have conformed to the average trajectory. The current central forecast is still close to the centre of all the previous prediction intervals (forecast ranges).  Developments over the last year suggest that, far from being irrelevant in this electoral cycle, history is still a valuable guide. If nothing else it provides a useful benchmark by which to judge party performance. More importantly, historical variation gives us a handle on how much things can change and how uncertain the outcome in May is.
Acknowledgments: Thanks to Will Jennings and Anthony Wells for polling data, to Jonathan Jones for his excellent work on ElectionsEtc.com (including editing this post) and to numerous people for comments on the methodology over the year. New comments still very welcome!

What do you think the impact of the Yorkshire First movement could be if they get their act together? Would they take away from UKIP given the number of disillusioned voters seeking something different?