
by John Curtice and Stephen Fisher
Much of the speculation about what might happen in the English local elections tomorrow has focused on how many seats each party – and especially Labour – could or should gain or lose. Indeed, we can expect many a judgement to be cast on Friday on the basis of this evidence. However, given that these elections are held under first past the post, seats won and lost can be a poor guide to how well a party has done in the ballot box. A party whose vote has fallen less than that of their principal rivals may gain seats even though it has lost votes. A third party whose vote is geographically spread may make a substantial advance in votes yet reap little reward on terms of seats. Meanwhile, even if these issues do not arise, seats won and lost only provide an indication of whether a party has lost or gained ground as compared with when the seats up for grabs were last contested – which (as this year) is usually four years ago.
Given these limitations, another key indicator of party performance that has come to be part of the ritual of local election night is the calculation of a ‘projected national share’ (PNS). This is an estimate of the share of the vote that the principal parties would have won in a GB-wide general election if voters across the country as a whole had behaved in the same way as those who actually voted in the local elections. It provides a single, seemingly straightforward measure of party performance that can tell us not only how well or badly a party has done as compared with four years ago, but also as compared with any previous local elections for which a PNS is available – even though the places in which local elections are held varies considerably from one year to the next.
Yet almost inevitably answering such a ‘what if’ question is not as straightforward as it might seem. Given the large number of wards being contested, the calculation of the PNS has to be made on the basis of a sub-sample of the local contests. None of the parties fight all of the wards being contested, and some may well fight fewer wards than others. At the same time, local election results in England tell us nothing about the performance of the nationalist parties in Scotland and in Wales. Any estimate of the PNS is affected by the decisions that are made about how best to address these issues. As a result, there has often been some (though typically limited) disagreement between the PNS that we have calculated for the BBC at previous local elections and that calculated by the local election experts, Colin Rallings and Michael Thrasher of Plymouth University, whose National Equivalent Vote (NEV) appears each year in The Sunday Times.
One feature of the modern electoral cycle that potentially can assist considerably in calculating the PNS is the fact that general elections are now always held on the same day as local elections. This means that in some parts of England at least, voters have the opportunity to vote in both a parliamentary and a local election on the same day. They do not necessarily vote the same way in the two sets of elections, but by comparing party performance in the two sets of elections, constituency by constituency, we can establish the extent to which a party has typically done better or worse in the local elections than in the parallel parliamentary election. This enables us to calculate a PNS for those local elections, and thus have to hand the firmest possible baseline for calculating a PNS for the local elections held during the course of the subsequent parliament.
The BBC’s estimate of the PNS this year will therefore be calculated primarily by comparing the performance of the parties on Thursday with their performance in the local elections last year. This also has the advantage that UKIP fought nearly all of the parliamentary seats in last year’s general election and thus for the first time we can calculate a PNS for what is now Britain’s third largest party in terms of votes in much the same way as we compute one for the Conservatives, Labour and the Liberal Democrats. In estimating a PNS for last year we have focused on the outcome in 74 parliamentary constituencies in which wards and parliamentary constituency boundaries coincide and in which all of the component wards were fought in the local elections by the Conservatives, Labour and the Liberal Democrats. In 38 of these constituencies UKIP also fought all of the component wards.
We find that, on average across these seats, the Conservatives won 3% less of the vote in the local elections than in the parliamentary contest, while Labour were two points adrift. UKIP’s performance in the seats where they put up a full slate of local candidates was typically in line with its parliamentary vote. The Liberal Democrats, in contrast, usually did rather better in the local ballot box than in the parliamentary one, on average by three points. At the same time ‘Others’, that is, primarily the Greens, were also doing rather better in the local ballot boxes.
Given these differences, and given also the shares of the vote that the parties won across Britain as whole in the parliamentary election last year, our PNS for 2015 is as follows:
| Conservatives | 35 |
| Labour | 29 |
| UKIP | 13 |
| Liberal Democrats | 11 |
| Others | 12 |
There is one important feature to note about this estimate, a feature that partly explains why our estimate differs somewhat from that of Rallings and Thrasher. Because it is based on the difference between the parties’ general election performance across Britain as a whole and that in the English local elections, it takes into account the decline in Labour’s parliamentary tally that arose from the collapse in the party’s support in Scotland (to the benefit of the SNP). This collapse cost the party some 2% of the GB-wide vote – and this two points drop will also be reflected in our estimate of the PNS on Thursday (which given the anticipated outcome of the Scottish election seems far from unreasonable).
Thus in making any comparison between the PNS for Labour on Thursday and that for any year prior to 2015, this two point difference needs to be borne in mind. For example, if Labour were to do as well in this year’s English local elections as they did in 2012, our PNS will credit the party with 36%, two points below the 38% score it was given that year. But, then, in order to be in the same overall position across Britain as it was four years ago, Labour is going to have to do better in England than it did on that occasion. Unfortunately for Labour, unless it can eventually prick the SNP bubble, standing still in England is not enough.
Here is a chart of all the PNS figures since 1982.
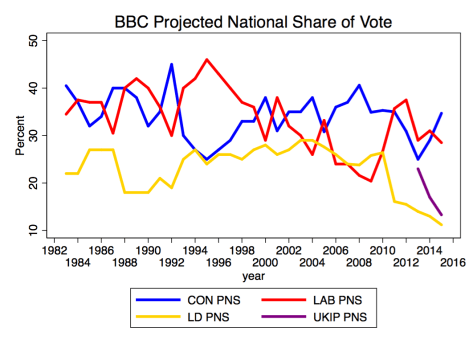
The data for the chart are listed in the table below.
| year | conPNS | labPNS | ldPNS | ukipPNS |
| 1982 | 40 | 30.5 | 26 | . |
| 1983 | 40.5 | 34.5 | 22 | . |
| 1984 | 37 | 37.5 | 22 | . |
| 1985 | 32 | 37 | 27 | . |
| 1986 | 34 | 37 | 27 | . |
| 1987 | 40 | 30.5 | 27 | . |
| 1988 | 40 | 40 | 18 | . |
| 1989 | 38 | 42 | 18 | . |
| 1990 | 32 | 40 | 18 | . |
| 1991 | 35 | 36 | 21 | . |
| 1992 | 45 | 30 | 19 | . |
| 1993 | 30 | 40 | 25 | . |
| 1994 | 27 | 42 | 27 | . |
| 1995 | 25 | 46 | 24 | . |
| 1996 | 27 | 43 | 26 | . |
| 1997 | 29 | 40 | 26 | . |
| 1998 | 33 | 37 | 25 | . |
| 1999 | 33 | 36 | 27 | . |
| 2000 | 38 | 29 | 28 | . |
| 2001 | 31 | 38 | 26 | . |
| 2002 | 35 | 32 | 27 | . |
| 2003 | 35 | 30 | 29 | . |
| 2004 | 38 | 26 | 29 | . |
| 2005 | 31 | 33 | 28 | . |
| 2006 | 36 | 24 | 26 | . |
| 2007 | 37 | 24 | 24 | . |
| 2008 | 41 | 22 | 24 | . |
| 2009 | 35 | 20 | 26 | . |
| 2010 | 35 | 27 | 26 | . |
| 2011 | 35 | 36 | 16 | . |
| 2012 | 31 | 38 | 16 | . |
| 2013 | 25 | 29 | 14 | 23 |
| 2014 | 29 | 31 | 13 | 17 |
| 2015 | 35 | 29 | 11 | 13 |
John Curtice is Professor of Politics at University of Strathclyde.

9 thoughts on “Calculating the Local Elections Projected National Share (PNS) in 2015 and 2016”