
By John Curtice and Stephen Fisher.
Part of the ritual of election-night coverage at the BBC is the calculation of the so-called Projected National Share (PNS). This is an estimate of the share of the vote that the principal parties would have won in a GB-wide general election if voters across the country as a whole had behaved in the same way as those who actually voted in the local elections. It provides a single, seemingly straightforward measure of party performance that can tell us not only how well or badly a party has done as compared with four years ago, but also as compared with any previous local elections for which a PNS is available – even though the places in which local elections are held varies considerably from one year to the next.
One of the key patterns in last year’s general election results was a tendency for those who voted Remain to swing more to Labour than those who voted Leave, while the Conservatives lost ground amongst Remain voters while advancing amongst their Leave counterparts. If a similar pattern is maintained at these local elections – and it was in last year’s county council elections – then the Labour vote will increase more (or fall less) were the Remain vote was higher in 2016, while the converse will be true of the Conservatives.
Meanwhile, in stark contrast to last year, this year’s local elections are being fought in mainly urban England, including not least Remain voting London. On average, they are in places where the Remain vote at the 2016 referendum was, at 49%, just a little above the level of the pro-EU vote in England as a whole (47%). They are thus only a little atypical. However, largely because London accounts for no less than 42% of all the seats up being contested this year, amongst the councils that do have local elections this week there are more seats being contested where the Remain vote was higher. When weighted by the number of seats they have up for election, the average Remain vote in those councils that have elections on Thursday is as much as 52%, some five points above the overall Remain vote in England in June 2016.
There is therefore a risk that the headline figures of gains and losses of seats will exaggerate the relative strength of Labour’s performance across England as a whole. However, this problem will not affect the PNS because the contribution of London to the calculation will simply reflect the proportion of the electorate that live in the capital, not the number of seats being contested. At the same time, we will also be checking that the slight over-representation of Remain voting areas in the set of councils voting this year is not biasing our estimate.
This, however, is not the only complication of which it is important to be aware in assessing this year’s PNS. The 2017 general election was the first in twenty years not to be held on the same day as local elections. This means that, in contrast to the position in the last five parliaments, none of the ward level results this year can be compared directly with what happened at the time of the last general election. Hitherto, the coincidence of local and general election results provided an opportunity to estimate a PNS for the parallel local elections by comparing the local and parliamentary election results in those constituencies where all the component wards were contested, and then applying the resulting difference for each party to its share of the Britain-wide parliamentary vote. The resulting general election year PNS then provided a robust baseline for the calculation of the PNS in the local elections that were held during the course of the subsequent parliament. This year, however, we will still be reliant on the baseline provided by the 2015 local elections, and even here that baseline can only be made directly for the results outside London.
One particular implication should be noted. The PNS calculated in a parallel local and general election year is particularly important in providing the baseline measure of support for Others, included in which – because the PNS an estimate of the parties’ share of the vote across Britain as a whole even though local elections are only taking place in England – is the support won by the nationalist parties in Scotland and Wales. Although the local elections provide information on changes in the level of support for Others in England which is reflected in our PNS, they do not provide any new information on the level of support for the nationalist parties in Scotland. We have to assume that it would be unchanged. This means that the strong SNP performance in 2015, partly but not fully replicated in 2017, is still reflected in our general election baseline year. The implications of this for the interpretation of the PNS and how parties’ performances should be compared with previous years were explained in more detail in our post in 2016 here.
There is, however, one important change being made to the treatment of Others. Between 2013 and 2017 we calculated a separate figure for UKIP. The party contested nearly every seat at the general election in 2015, and it seemed to make sense to calculate the PNS on the basis that they would continue to do so. However, the sharp decline in the number of UKIP candidates in this year’s local elections means that assumption no longer looks reasonable and, in any event, makes it impossible to calculate any realistic PNS estimate for UKIP in this year’s local elections. We are thus resorting to our former practice of only estimating Conservative, Labour and Liberal Democrat support separately. Consequently, our table of previous PNS estimates below does not show any separate figures for UKIP but includes the UKIP estimate for 2013 to 2017 in the tally for Others.
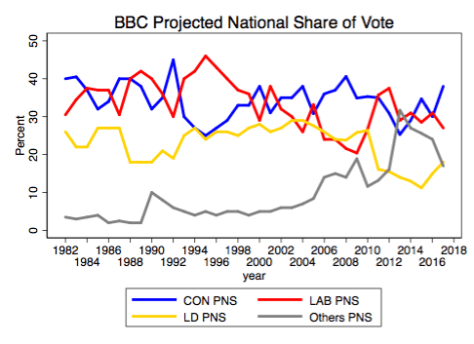
The data used to create the above figure are in the table below.
| Con | Lab | LD | Others | |
| 1982 | 40 | 30.5 | 26 | 3.5 |
| 1983 | 40.5 | 34.5 | 22 | 3 |
| 1984 | 37 | 37.5 | 22 | 3.5 |
| 1985 | 32 | 37 | 27 | 4 |
| 1986 | 34 | 37 | 27 | 2 |
| 1987 | 40 | 30.5 | 27 | 2.5 |
| 1988 | 40 | 40 | 18 | 2 |
| 1989 | 38 | 42 | 18 | 2 |
| 1990 | 32 | 40 | 18 | 10 |
| 1991 | 35 | 36 | 21 | 8 |
| 1992 | 45 | 30 | 19 | 6 |
| 1993 | 30 | 40 | 25 | 5 |
| 1994 | 27 | 42 | 27 | 4 |
| 1995 | 25 | 46 | 24 | 5 |
| 1996 | 27 | 43 | 26 | 4 |
| 1997 | 29 | 40 | 26 | 5 |
| 1998 | 33 | 37 | 25 | 5 |
| 1999 | 33 | 36 | 27 | 4 |
| 2000 | 38 | 29 | 28 | 5 |
| 2001 | 31 | 38 | 26 | 5 |
| 2002 | 35 | 32 | 27 | 6 |
| 2003 | 35 | 30 | 29 | 6 |
| 2004 | 38 | 26 | 29 | 7 |
| 2005 | 31 | 33 | 28 | 8 |
| 2006 | 36 | 24 | 26 | 14 |
| 2007 | 37 | 24 | 24 | 15 |
| 2008 | 41 | 22 | 24 | 13 |
| 2009 | 35 | 20 | 26 | 19 |
| 2010 | 35 | 27 | 26 | 12 |
| 2011 | 35 | 36 | 16 | 13 |
| 2012 | 31 | 38 | 16 | 15 |
| 2013 | 25 | 29 | 14 | 32 |
| 2014 | 29 | 31 | 13 | 27 |
| 2015 | 35 | 29 | 11 | 25 |
| 2016 | 30 | 31 | 15 | 24 |
| 2017 | 38 | 27 | 18 | 17 |

3 thoughts on “Calculating the local elections Projected National Share (PNS) in 2018”