
By Stephen Fisher.
People often wonder what local election results bode for the next general election. Here is a quick look at the relationship between the BBC Projected National Share of the vote (PNS) in the local elections and the outcome of subsequent general elections. In particular, I focus on the lead for the main opposition party over the principal governing party. The graphs below show the lead at the subsequent general election plotted against the lead in the PNS.
First consider the experience of Labour in opposition. The PNS has only been calculated since 1982. Since then the Conservatives have only lost one general election while in government (1997). With the exception of the 1992 local elections, which were held only a month after the general election, there were big leads – of 10 points or more – for Labour in the PNS for all the local elections between 1992 and 1997 general elections. What is more, all those leads were bigger than any other Labour PNS lead while in opposition. Neither Neil Kinnock’s 8-point lead in 1990, nor Ed Miliband’s 7-point lead in 2012 proved to be enough.

The following graph shows results for those local elections, like this year’s, that were held just a year after a general election. Labour recorded small leads in all of them, apart from in 1993. Already at this time there were signs that Labour might win the next election, much aided by the ERM crisis but not yet by Blair’s leadership.

Matching or beating the 10-point lead from 1993 looks like a tall order for Labour today. But the graph shows that even if Jeremy Corbyn cannot match that performance, he only has to beat his own 1-point lead from 2016 to do better than any other Labour opposition leader a year after a Tory general election victory apart from John Smith.
The Conservative experience in opposition less clear cut. There is no dividing line between local election leads before a victory and those that preceded defeat. There were only three parliaments with Labour governments for which we have PNS figures. The Tories only won one of the subsequent general elections (2010). The Conservatives clocked up big 12+ point leads in all the local elections between 2005 and 2010. While this apparently heralded their future return to power even before the financial crisis. However, Michael Howard achieved the same 12-point lead in 2004 that David Cameron did in 2006, but Howard went on to lose in 2005 whereas Cameron won in 2010.
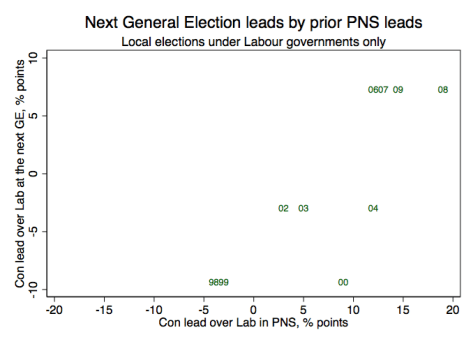
Since 2006 was also a post-election year, Cameron’s performance then is arguably another target for Jeremy Corbyn today. But it is one that is even harder to reach than John Smith’s.
On this basis Labour need to achieve a PNS lead over the Conservatives approaching 10 points to convincingly claim that there is evidence that they are on course to win the next general election. But if Mr Corbyn fall short of that target it would not mean Theresa May has nothing to worry about. The experience of 2017 shows that even a major 11-point lead for a government in the local elections is no guarantee of resounding success in a subsequent general election, even one just a month later.
There is a long time to go to the next scheduled general election in 2022. A lot could change in the meantime. Whatever the results of the local elections today, the outcome of the next general election is far from a foregone conclusion.
For more information on what the PNS is and how it is calculated see here.

Reblogged this on MUSO MUSINGS ON FATHERHOOD THEORY AND STUFF and commented:
Check out some proper analysis in the calm reflective light of reason not the heat of media demanded soundbite hype.
Blog relocated its that time of year again? Only this time it’s different?