
By Stephen Fisher, John Kenny and Rosalind Shorrocks
There are still just a few different forecasts for the general election. Perhaps the big changes during the 2017 campaign have made people more hesitant about predicting early this time. Perhaps the problems of the polls in 2015, 2016 and 2017 have put some off the idea entirely. (More on this in our post-mortem for the 2017 combined forecast which we’re still working on.) Nonetheless, this is the second of our weekly blogs where we review the different forecasts from different methods and combine them into an overall forecast.
Here we aggregate seats and vote share forecasts from a variety of sources including betting markets, polls, statistical forecasting models and citizen forecasts. As well as updating weekly, the methodology (as detailed below) might well evolve. So comments and suggestions on our approach and for new forecasts to include are welcome.
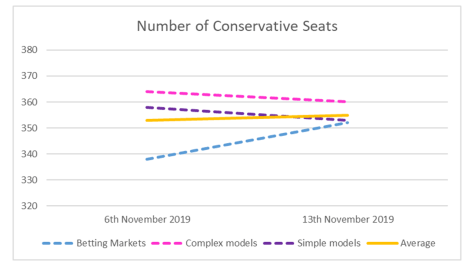
Just as they did last week, all the different sources point to the Conservatives being comfortably the largest party, with heavy losses for Labour and modest gains for the Liberal Democrats and Scottish National Party (SNP). Last week the betting markets suggested a smaller Tory tally than did the forecasting models. The models haven’t changed much but the betting markets have moved into line with forecasts. On average across betting markets, and complex and simple models, the Tories are expected to win with a comfortable majority of 60, barely changed from 57 last week. All three sources now suggest a majority of 50 or more.
| Seats | Betting Markets | Complex models | Simple models | Average |
| Con | 352 | 360 | 353 | 355 |
| Lab | 210 | 201 | 193 | 201 |
| LD | 37 | 25 | 30 | 31 |
| Brexit | 0 | 0 | 0 | |
| Green | 2 | 1 | 1 | 1 |
| SNP | 46 | 48 | 50 | 48 |
| PC | 5 | 4 | 4 | 4 |
| Con majority | 54 | 70 | 56 | 60 |
Last week our citizen forecast pseudo-probability average was as little as 22% for the chances of a Conservative majority. We’ve now realised that we were mistaken for including the Don’t Know respondents in the baseline. Our revised citizen forecast for last week is 29%. As on the seats forecast, the betting markets have moved in line with the polls and the one poll-based forecasting model with a stated probability of a Tory majority that we know of (Electoral Calculus). The poll based pseudo-probability of a Tory landslide has come down 0.25 to 0.13, consistent with the slight contraction of the vote share lead (see below) but there are a couple of pollsters with leads just short of the 12.5 point cut-off (see methodology below). All the most recent polls in the last week still have Conservative leads over Labour that suggest a Tory majority on uniform change calculations. By contrast the Good Judgement Project volunteered forecasts and the citizen forecasts are still much more circumspect. Overall the combined probability of a Tory majority is 60%.
| Probabilities | Betting markets | Models | Polls | Citizen forecast | Volunteered | Average |
| Conservative Majority | 0.63 | 0.68 | 1.00 | 0.24 | 0.45 | 0.60 |
| Conservative landslide | 0.13 | |||||
| Boris Johnson next PM | 0.77 | 0.65 | 0.71 | |||
| Jeremy Corbyn next PM | 0.24 |

The sources for vote-share forecasts all show a slight narrowing of the Conservative lead over Labour from 11 points on average last week to 10 points this week. That is consistent with a big majority on seats but not a landslide. Relative to the polls the betting markets, and to a lesser extent the forecasting models, are expecting a bit of a Labour recovery and a more substantial squeeze on the Brexit Party vote. Betting markets and models disagree as to whether the Liberal Democrats will rise or fall relative to current polls, but not much change is expected by either.
| % GB Vote | Poll aggregates | Betting markets | Models | Average |
| Con | 38.3 | 39.1 | 39.1 | 38.8 |
| Lab | 28.2 | 29.9 | 28.7 | 28.9 |
| Lib Dem | 16.2 | 18.5 | 15.2 | 15.7 |
| Brexit | 8.9 | 4.3 | 7.5 | 6.9 |
| Green | 3.2 | 2.8 | 3.0 | |
| SNP | 3.5 | 3.4 | 3.4 | |
| PC | 0.7 | 0.6 | 0.6 | |
| Con-Lab lead | 10.1 | 9.2 | 10.4 | 9.9 |

Methodology
The idea of combining forecasts from different sources has a good track record, though it has to be admitted that our attempts for the 2017 general election and the 2016 Brexit referendum did not work out well. We will write more about those experiences soon. Also worth noting is the experience of the pollyvote.com combined forecast of the US presidential elections.
The basic approach is to combine forecasts by averaging them within each category and then average across categories. Since the different sources do not all present similar figures that can be averaged on a like for like basis there are various judgement calls we have had to make on how to treat the data.
The main changes in method this week are: UK Elect is excluded from the polling average as it’s current polling average is older than 7 days; we have changed the way we calculate pseudo-probabilities from citizen forecasts (see below) and there is a new seats forecast from Helmut Norpoth that we are including. We haven’t included the headline seats tally from the Best for Britain/Focaldata MRP model mainly because we’re not sure they count as official forecasts from the people that generated them. The same is true of figures from other tactical voting websites so far as we know. That said, all those MRP headline seats figures are not terribly different from the ones from our Complex Models in the table above.
Polls
For vote shares, we use the various available polling averages. There are various different polling averages. Some admittedly are quite sophisticated, allowing for house effects, but they are nonetheless estimates of current public opinion and not future votes. We only use polling averages that have been updated in the last 7 days.
To estimate a pseudo-probability of a Conservative majority from the polls, we use the Conservative lead over Labour in the most recent poll from each pollster, provided it was fielded in the last 7 days. The probability of a Conservative majority is taken as the proportion of polls with a lead of above 3.1, and the probability of a Conservative landslide (100+ majority) is taken as the proportion of polls with a lead above 12.5. These cut-offs are taken from Table A1.9 of the Curtice et al. constituency-results analysis in The British General Election of 2017 (by Cowley and Kavanagh).
The pollsters vary considerably in the lead they attribute to the Conservatives. Since nearly all the pollsters are doing polls at least once a week and since we take just the most recent poll from each pollster, our calculated probabilities of a Conservative majority from the polls should not be, and do not seem to be, much affected by any changes in the composition of our poll lead average.
Statistical models
There are just a few statistical forecasting models this year (but hopefully more to come). We have divided them between simple (poll average plus uniform swing seats projection) and complex (anything more elaborate but not necessarily particularly complex). Within these categories we simply average the available estimates of seats and shares. We have not excluded any models based on quality, but they do have to be statistical models as opposed to personal guesses. We only include models that have been updated in the last 7 days.
Betting markets
For the seats forecasts we are using just the mid points of the spread betting for the markets. Note that the markets might imply fewer or more seats forecast for the main parties than there are in Britain. This is because the markets are separate for each party and do not need to be consistent collectively.
Betting markets for shares of the vote are typically done in bands. We take the mid points of the (up to) three bands with the highest implied probabilities weighted by their implied probabilities from the betting odds, averaging across bookies.
Citizen forecasts
Some polls ask people what they think that the outcome will be on December 12th. We call these ‘citizen forecasts.’ Different pollsters use different survey questions but they can be combined to generate pseudo-probabilities. We use the proportion of poll respondents who think there will be a Conservative majority, excluding don’t knows and re-percentaging, as the pseudo-probability of a Conservative majority. We similarly use the proportion of poll respondents who think that Boris Johnson will become the next Prime Minister, and similarly generate a pseudo-probability for this outcome excluding the don’t knows. We take the most recent such poll from each pollster in the previous two weeks, although it should be noted that only a few pollsters ask such questions.
In our first 2019 forecast on 6thNovember, we did not exclude the don’t know responses when calculating these pseudo-probabilities, and so the probabilities of Conservative majority/Johnson next PM are artificially lower last week compared to this week. If we had excluded the don’t knows last week, the probability of a Conservative majority from the citizen forecasts would have been 0.29 (compared to 0.22) and the probability of Boris Johnson as the next Prime Minister would have been 0.66 (compared to 0.47).
Volunteered forecasts
These come from the Good Judgement Project, which encourages people to forecast the outcomes of various events in order to develop and improve their forecasting skills. The people providing their predictions to the Good Judgement Project are not necessarily experts, but nor can they be seen as a representative sample, and so we report their predictions separately as ‘volunteered’ forecasts.
Estimates come from mid-morning on 13thNovember 2019.
Sources
Citizen forecasts:
Forecasting models:
Electoral Calculus
Polling Averages (less than a week old):
BBC
Prediction markets:
Betfair
Volunteered:
