
By Stephen Fisher, John Kenny and Rosalind Shorrocks
Since our first combined forecast at the start of the campaign, the number of forecasts for this general election has grown substantially. All of the combined forecasts – seats, vote shares, and probabilities – are pointing to a Conservative majority. However, some individual forecasts do predict a hung parliament, and there is variation within each forecast type over how certain this majority is, and how large it is predicted to be.
SEATS
Seat projections from the betting markets, complex models, and simple models are all very similar, forecasting a Conservative majority of between 343 and 351 seats. The average number of seats across all forecasts that the Conservatives are expected to win – 341 – is slightly lower but ultimately very similar to the forecast last week.
Since last week the Political Studies Association have published their Expert Survey, in which the average expected number of Conservative seats suggests a hung parliament with the Conservatives just shy of a majority. It is interesting that the experts surveyed by the PSA predict the Conservatives will win fewer seats than is currently suggested by the polls. Perhaps they are factoring in the same kind of late-campaign changes as observed in 2017 – although it should be noted that when a similar kind of survey was run for the EU referendum in 2016, the average predicted vote share for Remain and Leave amongst experts was the furthest away from the actual result than any of the other types of forecast. They also predicted a Conservative majority in 2017, although that prediction was made much more earlier in the campaign when the Conservatives had considerable leads over Labour in the polls.
| Seats | Betting Markets | Complex models | Simple models | Experts | Average |
| Con | 346 | 343 | 350 | 324 | 341 |
| Lab | 221 | 225 | 219 | 233 | 224 |
| LD | 18 | 17 | 18 | 25 | 19 |
| Brexit | 0 | 0 | 0 | 2 | 1 |
| Green | 1 | 1 | 1 | 2 | 1 |
| SNP | 43 | 44 | 41 | 42 | 43 |
| PC | 4 | 3 | 3 | 4 | 4 |
| Con majority | 42 | 37 | 49 | -2 | 31 |
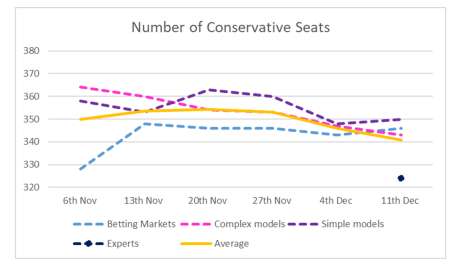
The similarity between the seat projections from most sources hides considerable variation within one particular forecast type – complex models. These models range from predicting 311 Conservative seats to 366 – the difference between a hung parliament and a healthy Conservative majority. They also range between 190 and 268 for Labour. It is particularly noteworthy that the voter expectation model, from Murr, Stegmaier, and Lewis-Beck, which uses citizen forecasts to predict the number of seats, forecasts one of the highest number of Conservative seats (360) and the lowest number of Labour seats (190). This is in contrast to our implied probability calculated from the citizen forecasts, which suggest that citizens are in general the least convinced about the likelihood of a Conservative majority compared to other forecasting methods. This suggests these surveys also suffer from being open to multiple interpretations and methods of analysis, as well as the question wording effects we discussed last week.
YouGov’s MRP prediction is now less favourable to the Conservatives than last week – but still predicts a Conservative majority overall, with 339 seats for the Conservatives. Forecasts that use historic information on swing (Lebo and Fisher) and local election results (Prosser and Fisher) are the least favourable to the Conservatives.
| Con | Lab | LD | SNP | PC | Greens | |
| PM and Pendulum: Lebo and Fisher | 311 | 268 | ||||
| PSA Expert Survey | 324 | 233 | 25 | 42 | 4 | 2 |
| Prosser and Fisher (local elections based) | 329 | 231 | 23 | |||
| 326 politics | 336 | 230 | 17 | 44 | ||
| PME Politics & Bailey | 337 | 228 | 17 | 44 | 4 | 1 |
| Best for Britain/Focaldata | 337 | 235 | 14 | 41 | 3 | 1 |
| YouGov MRP | 339 | 231 | 15 | 41 | 4 | 1 |
| Party Leadership Model (Murr) | 342 | 254 | ||||
| Opros | 343 | 211 | 27 | 46 | 3 | 1 |
| Datapraxis MRP | 344 | 221 | 14 | 47 | 4 | 1 |
| UNS from Poll Average | 345 | 224 | 18 | 41 | 3 | 1 |
| Betting markets average | 346 | 221 | 18 | 43 | 4 | 1 |
| Electoral Calculus | 348 | 227 | 13 | 41 | 2 | 1 |
| UKElect | 348 | 217 | 17 | 44 | 4 | 1 |
| PM and Pendulum: Norpoth | 352 | 228 | ||||
| Principal Fish | 354 | 214 | 18 | 41 | 3 | 1 |
| Forecast UK | 358 | 203 | 20 | 46 | 4 | 1 |
| Citizens: Murr, Stegmaier and Lewis-Beck | 360 | 190 | 16 | |||
| Nigel Marriot | 366 | 200 | 12 | 49 | 3 | 1 |
| Average | 343 | 225 | 18 | 44 | 3 | 1 |
While there are 19 different forecasts in the above table it is striking that there are some classic forecasting methodologies that are not represented. There is no local by-elections model and perhaps most importantly given their prominence in the literature, no macro-economic indicator based forecast.
VOTE SHARES
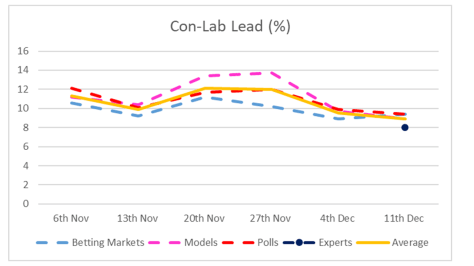
The combined forecast vote share still suggests a reasonable Conservative lead over Labour, although it has slightly narrowed from 9.5 last week to 8.9 this week. All sources in this combined forecast show this narrowing. As above, the expert survey prediction from the PSA predicts the lowest Conservative vote share, although this still predicts on average a Conservative lead of 8 points. The betting markets and the polls are expecting the largest Conservative lead, although the model predictions are not far behind. There is less variation between the models in terms of their vote share projections than their seat projections, although the models which make use of more long-term data (e.g. Mongrain, and Prosser and Fisher) rather than current polls tend to give the Conservatives the lowest vote shares.
There is, as has been the case across the campaign, considerable variation across pollsters in the size of the Conservative lead over Labour. The average Conservative lead across the final polls (excluding Ipsos MORI) is 9.58. SavantaComRes suggests a lead of just 5 percentage points, which would imply a Conservative majority of just 8. They caution that the election is too close to call and there are still a high number of voters who might change their mind before casting their vote. Qriously, on the other hand, has a Conservative lead over Labour of 13 percentage points, implying a Conservative majority of 72. From the perspective of the polls at least, the picture is very mixed about what we can expect on Thursday night.
| % GB Vote | Poll aggregates | Betting markets | Models | Experts | Average |
| Con | 42.9 | 43.0 | 41.3 | 39.0 | 41.6 |
| Lab | 33.5 | 33.7 | 32.4 | 31.0 | 32.6 |
| Lib Dem | 12.3 | 13.0 | 13.4 | 15.0 | 13.4 |
| Brexit | 3.0 | 3.5 | 3.2 | 6.0 | 3.9 |
| Green | 2.8 | 2.7 | 4.0 | 3.2 | |
| SNP | 3.6 | 3.4 | 3.5 | ||
| PC | 0.5 | 0.6 | 0.6 | ||
| Con-Lab lead | 9.4 | 9.4 | 8.9 | 8.0 | 8.9 |
The following table includes the final polls at the time of writing (missing only MORI we think) and uniform change projections from them. The projections are indicative only. Pollsters should not be judged on these projections.
Table of final polls and uniform change projections
| % Vote share | Uniform change projections | ||||||||
| Con | Lab | LD | Con-Lab lead | Con majority | Con | Lab | LD | SNP | |
| ComRes | 41 | 36 | 12 | 5 | 8 | 329 | 238 | 19 | 42 |
| ICM | 42 | 36 | 12 | 6 | 16 | 333 | 235 | 19 | 41 |
| BMG | 41 | 32 | 14 | 9 | 30 | 340 | 225 | 21 | 42 |
| YouGov | 43 | 34 | 12 | 9 | 36 | 343 | 225 | 19 | 41 |
| Panelbase | 43 | 34 | 11 | 9 | 38 | 344 | 225 | 18 | 41 |
| Average | 43 | 34 | 12 | 9 | 40 | 345 | 224 | 18 | 41 |
| Deltapoll | 45 | 35 | 10 | 10 | 48 | 349 | 221 | 16 | 42 |
| Survation | 45 | 34 | 9 | 11 | 54 | 352 | 218 | 16 | 42 |
| Kantar | 44 | 32 | 13 | 12 | 68 | 359 | 209 | 19 | 41 |
| Opinium | 45 | 33 | 12 | 12 | 70 | 360 | 209 | 18 | 41 |
| Qriously | 43 | 30 | 12 | 13 | 72 | 361 | 207 | 19 | 41 |
Note: Uniform change projection uses the SNP share of the Scottish vote and PC share of the Welsh vote from the YouGov MRP for all projections. YouGov shares are from MRP but seats are uniform projections like others in the table.
PROBABILITY OF CONSERVATIVE VICTORY
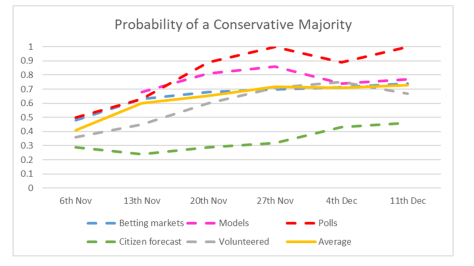
The combined forecast for a Conservative majority remains almost identical to last week, at 0.73. As before, citizen forecasts are the least convinced of this outcome, whilst the polls universally indicate a Conservative majority, albeit a slim one in some cases. The betting markets and models are similar to each other and more confident of a Conservative majority than citizens, but less so than what is implied from the polls. The expert survey from the PSA asked about the probability of a Conservative landslide (100+ majority): the probability assigned to that outcome was 0.27, again in contrast to the polls, none of which are showing Conservative leads large enough to have a majority of over 100 seats.
| Probabilities | Betting markets | Models | Polls | Citizen forecast | Volunteered | Experts | Average |
| Conservative Majority | 0.74 | 0.77 | 1.00 | 0.46 | 0.67 | 0.73 | |
| Conservative landslide | 0.00 | 0.27 | 0.14 | ||||
| Boris Johnson next PM | 0.80 | 0.74 | 0.77 | ||||
| Jeremy Corbyn next PM | 0.22 | 0.19 | 0.21 |
Methodology
The idea of combining forecasts from different sources has a good track record, though it has to be admitted that our attempts for the 2017 general election and the 2016 Brexit referendum did not work out well. See here for a review of our 2017 forecasts. Also worth noting is the experience of the pollyvote.com combined forecast of the US presidential elections.
The basic approach is to combine forecasts by averaging them within each category and then average across categories. Since the different sources do not all present similar figures that can be averaged on a like for like basis there are various judgement calls we have had to make on how to treat the data.
The main changes in method this week are the new Expert Survey from the PSA, the Party Leadership Model (Murr), the Local Elections model (Prosser) and Nigel Marriot’s forecast.
Polls
For vote shares, we use the various available polling averages. There are various different polling averages. Some admittedly are quite sophisticated, allowing for house effects, but they are nonetheless estimates of current public opinion and not future votes. We only use polling averages that have been updated in the last 7 days.
To estimate a pseudo-probability of a Conservative majority from the polls, we use uniform change projections for each of the most recent polls from each pollster in the last week. For these we also take estimates for the SNP and Plaid Cymru shares from the most recent polls in Scotland and Wales. The proportion of these projections with a Conservative majority is taken as a pseudo-probability, and similarly we consider the proportion pointing to a majority of over 100 as a pseudo-probability of a landslide.
The pollsters vary considerably in the lead they attribute to the Conservatives. Since nearly all the pollsters are doing polls at least once a week and since we take just the most recent poll from each pollster, our calculated probabilities of a Conservative majority from the polls should not be, and do not seem to be, much affected by any changes in the composition of our poll lead average.
Statistical models
We have divided statistical models into simple (poll average plus uniform swing seats projection) and complex (anything more elaborate but not necessarily particularly complex). Within these categories we simply average the available estimates of seats and shares. We have not excluded any models based on quality, but they do have to be statistical models as opposed to personal guesses. We only include models that have been updated in the last 7 days.
Betting markets
For the seats forecasts we are using just the mid points of the spread betting for the markets. Note that the markets might imply fewer or more seats forecast for the main parties than there are in Britain. This is because the markets are separate for each party and do not need to be consistent collectively.
Betting markets for shares of the vote are typically done in bands. We take the mid points of the (up to) three bands with the highest implied probabilities weighted by their implied probabilities from the betting odds, averaging across bookies.
Citizen forecasts
Some polls ask people what they think that the outcome will be on December 12th. We call these ‘citizen forecasts.’ Different pollsters use different survey questions but they can be combined to generate pseudo-probabilities. We use the proportion of poll respondents who think there will be a Conservative majority, excluding don’t knows and re-percentaging, as the pseudo-probability of a Conservative majority. We similarly use the proportion of poll respondents who think that Boris Johnson will become the next Prime Minister, and similarly generate a pseudo-probability for this outcome excluding the don’t knows. We take the most recent such poll from each pollster in the previous two weeks, although it should be noted that only a few pollsters ask such questions.
Volunteered forecasts
These come from the Good Judgement Project, which encourages people to forecast the outcomes of various events in order to develop and improve their forecasting skills. The people providing their predictions to the Good Judgement Project are not necessarily experts, but nor can they be seen as a representative sample, and so we report their predictions separately as ‘volunteered’ forecasts.
Estimates come from late evening and up to around midnight on 11th December 2019.
Sources
Citizen forecasts:
Experts:
Forecasting models:
Bailey and English
Best for Britain/Focaldata
Murr, Stegmaier and Lewis-Beck
Authors’ own uniform change projections
Polling Averages (less than a week old):
Bailey and English
Britain Elects
Election Polling
Principalfish
Authors’ own calculations
Prediction markets:
Betfair
Volunteered:
