
by Stephen Fisher, 6th May 2021.
Local election seat gains and losses are hideous to try to predict at the best of times. Various factors make this year especially hard. The Covid-19 pandemic means that the 2020 round of local elections was postponed to today, and there have been various boundary changes and restructuring that mean it is hard to allocate many seats to either the 2016-2020 or the 2017-2021 4-year cycle that my model requires. Nonetheless, and despite the weaknesses of my 2019 forecast (discussed below), I have ploughed on regardless. This is not due to the kind of stoic determination that the Finns call sisu: amusingly summarised by someone as, “chin down and press on to the next disappointment.” Rather, I am still curious as to how much of a guide (on a broad macro level) Westminster vote intention polls are to local election outcomes.
Headline forecasts are in the table below together with the range of possible outcomes in the model. The table includes the projections from Michael Thrasher’s second scenario here. He and Colin Rallings would normally calculate an expected National Equivalent Vote (NEV) from the results of local by-elections, but those have not been happening. Instead Michael Thrasher has used adjusted opinion polls to estimate the NEV and then projected the implied changes at the ward/division level. Both mine and his methods use polls this year, but whereas Michael’s is a local projection based on previous ward and division level results, mine is based on regression models of the macro historical relationship between poll changes and net seat changes. (For a really micro, individual-level approach, predicting Labour losses in “red-wall” councils, but not overall net gains and losses, see the analysis from YouGov’s Patrick English here.)
Table 1. Forecasts for English local election net seat changes 2021
| Forecast | Range | Thrasher | |
| Con | -210 | -770 to +350 | +120 |
| Lab | +70 | -290 to +430 | -50 |
| LD | +140 | -50 to +330 | -70 |
| Others | 0 | 0 |
It is striking that my forecasts point in different directions from Michael Thrasher’s projections for every party. But with 4630 odd seats up for election, both sets of predictions are for modest net changes. The prediction intervals for my forecasts comfortably include zero for all three parties, so each of them could easily end either up or down when all the results are in.
I’ve some thoughts below as to why the two Liberal Democrat differ in direction, but I’m unclear as to why the two methods generate different expectations for the Conservatives and Labour. What follows is an explanation as to why the central predictions from my method are suggesting Tory losses and Labour and Liberal Democrat gains.
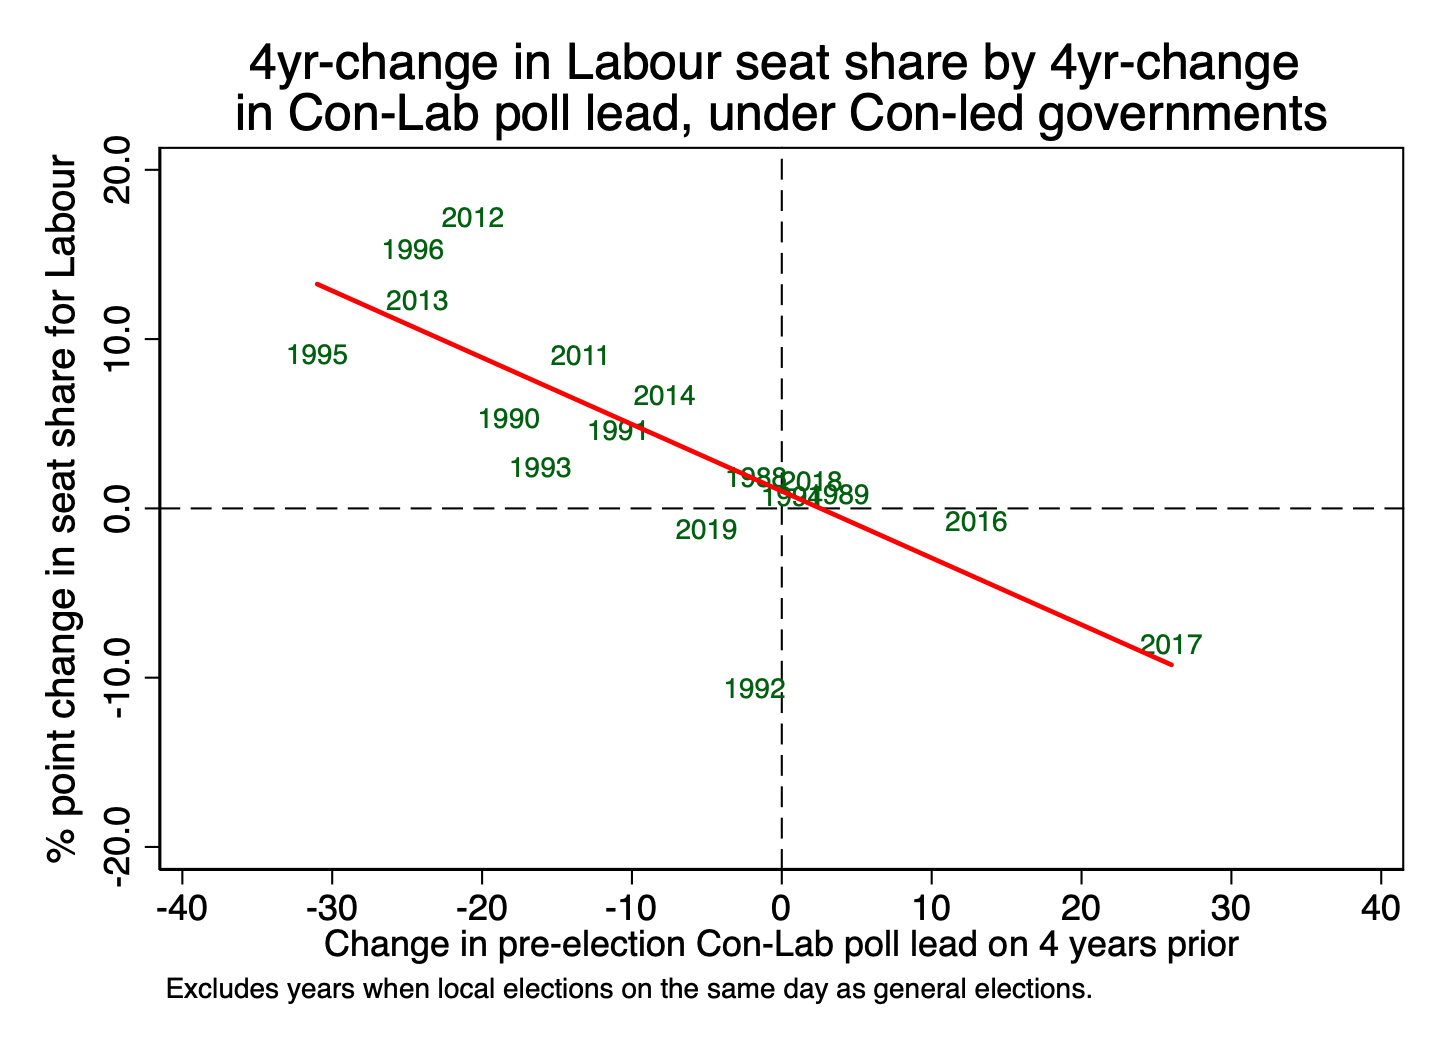
For the Conservative and Labour my simple model has a single predictor and can be illustrated in the graphs below. For periods of Conservative led government there is a reasonably strong correlation between the change in the net gain/loss of seat share on four years previously and the change in the Con-Lab lead in the GB vote intention polls relatively to four years before. The graphs show that when the poll lead goes up the Conservatives typically make gains and they suffer losses when the Conservative poll lead goes down, and vice versa for Labour. The regression lines cross remarkably close to the origin.
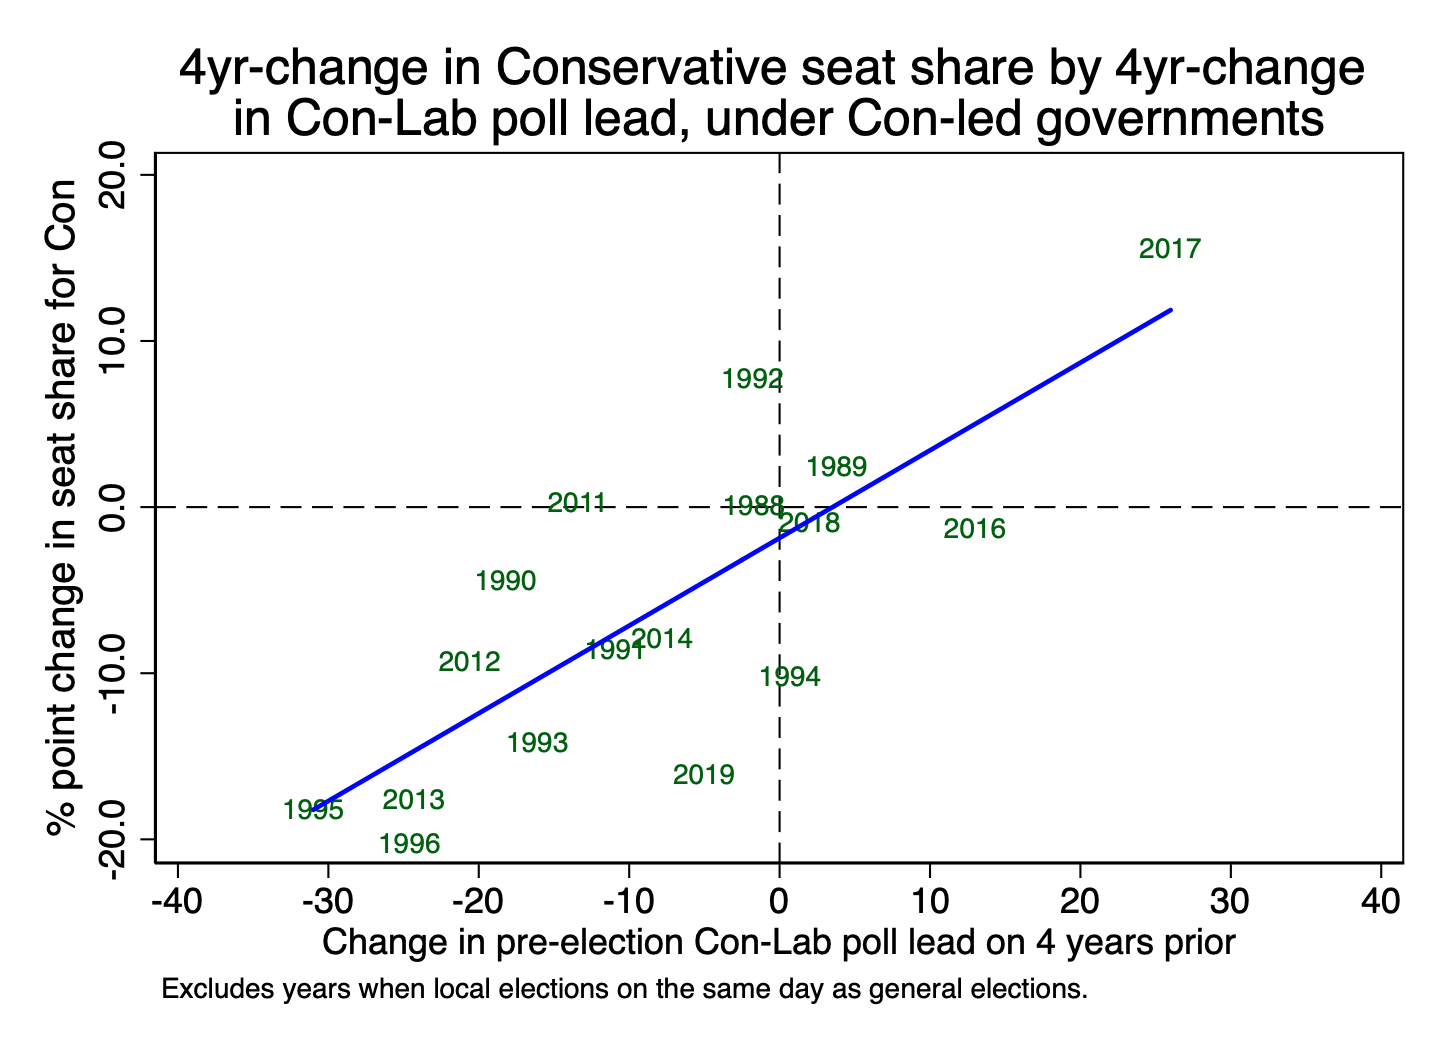
The model fits better for Labour than for the Conservatives, perhaps mainly because historically Labour have had (in the Conservatives) just one principal opponent locally, but the Conservatives have often been fighting on two fronts. There are plenty of Conservative-Liberal Democrat contests, but not so many Labour-Liberal contests. But intriguingly, while the 4-year change in the Conservative-Liberal Democrat poll lead is the core predictor in my Liberal Democrat seat change model, it does not add much value to the Conservative seats model.
This year the Conservative-Labour poll lead is 5 points. That is down 13 from the massive 18-point lead Theresa May enjoyed in late April and early May 2017, after she called the general election but before the local elections that year. As can be seen from the graphs above, the Conservatives made big gains in 2017, and they can be expected to lose many of those seats this year.
But a 5-point Conservative-Labour lead is only a slight rise from the 4-point lead in the polls going into the 2016 local elections. Seats that were last fought that year were supposed to be up for election last year, but those elections were deferred to this year because of the pandemic. For this group of seats, the change in the polls since 2016 suggest very little net change in seat control for both main parties.
So, the overall forecast for 2021 is dominated by the decline in the Conservative lead since 2017.
The graphs also help to illustrate uncertainty in the forecast. Take the 13 point drop in the lead since 2017. The regression line suggests that the Conservatives would be expected to lose in the order of 9% of the total number of seats up for election (the model is not a proportional change model). But, in 2011 the Conservative poll lead was down 13 points on what it was 4-years before, but the party made small net gains. A big drop in the polls does not necessarily mean big losses at the local elections, even if on average it has tended to.
Based on poll changes alone, the Liberal Democrat forecast would be for very slight net gains among the seats that were last fought in 2017, since the Conservative lead over the Liberal Democrats has shrunk from 36 to 34 points in the polls. But that 34-point lead is up on the 29 point Conservative-LibDem lead from 2016. So more substantial, but still modest, Liberal Democrat losses among the seats last fought in 2016 could be expected. However, in addition to the general tendency for the Liberal Democrats to do better when they are less far behind the Conservatives, the Lib Dems did particularly badly in local elections while they were in coalition government between 2010 and 2015. But they seem to be recovering in local elections somewhat since. Apart from very modest losses in 2017, they have made gains in other local elections since 2015. My model that also factors in a coalition slump and a post-coalition recovery suggests net gains for the Liberal Democrats today. But there is a risk that prediction is too strongly influenced by the party’s success in the extraordinary circumstances of the 2019 local elections. That is probably a key reason why my forecast points in a different direction from that of Michael Thrasher’s projection above.
As well as the Liberal Democrats achieving +704 net gains in 2019, independents, residents’ associations and candidates for parties other than the Conservatives, Labour and Liberal Democrats saw a net increase of +717 councillors. This includes +192 for the Greens. Whether that was just the temporary result of the “plague on both your houses” mood of the voters at the height of the parliamentary wrangling over Brexit in 2019, or whether it marks that start of a revival of non-aligned local government, we shall see.
But 2019 constituted a remarkable turn-around for the Others that revealed something about the nature of my forecasting models. The regression models tend to produce net losses for Others (as the 2019 post-mortem below shows) because between 1983 and 2018 the number of Other councillors in England declined by an average of 50 a year. The gains for Others in 2019 brought the overall share of Other councillors in Britain up from 10% to 14%, the highest level since 1986. While this might have been a one off, I have chosen to adjust the predicted net changes from the three main parties so they net to zero (as above) rather than have an implied prediction of further decline for Others.
Forecast performance in 2019
Since there were no local elections in 2020, the last forecasts were in 2019. The sources and commentary on them are here. The table below shows that all the forecasters correctly anticipated big Conservative losses, but not as big as eventually transpired. No one predicted net Labour losses, and my model for Labour did especially badly. But the outcome that took most by surprise was the rise of the Others. Although Robert Hayward’s forecast implied no net change for others, he did say that there were signs of potential Other gains in a pre-election HuffPost Commons People podcast.
Table 2. Forecasts for English local election net seat changes 2019
| Actual | Forecast | Range | Rallings & Thrasher | Hayward | |
| Con | -1335 | -700 | -90 to -1300 | -405 | -800 |
| Lab | -86 | +590 | +200 to +990 | +105 | +300 |
| LD | +704 | +350 | -10 to +720 | +400 | +500 |
| Others | +717 | -240 | -100 | 0 |
Discussions of past local election forecasts and other aspects of local election analysis can be found by following the “Local Elections” archive link in the category list on the right-hand side of this site.
Acknowledgements: Thanks to David Cowling, Colin Rallings, Michael Thrasher, the BBC and House of Commons Library for help with the data.
