
By John Curtice and Stephen Fisher.
This post is a revised and updated version of a similar post from 2019 here.
A key summary statistic of the outcome of each year’s annual round of local elections is the so-called Projected National Share (PNS). This is an estimate of the share of the vote that the principal parties would have won in a GB-wide general election if voters across the country as a whole had behaved in the same way as those who actually voted in the local elections. It provides a single, seemingly straightforward measure of party performance that can tell us not only how well or badly a party has done as compared with four years ago (when, typically, most of the seats up for grabs were last contested), but also as compared with any previous local election for which a PNS is available – even though the places in which local elections are held varies considerably from one year to the next.
In this blog we provide some guidance as to how the PNS is being calculated this year by the BBC and how it will be used to project an outcome in terms of House of Commons seats.
A double round of elections is being held this year. One round is being conducted in places that should have held elections last year but were postponed because of the Covid-19 pandemic. The other round comprises those elections that have long been scheduled for 2021. The delayed elections are nearly all for seats that were last contested in May 2016, before the Brexit referendum in June of that year. By contrast, the elections that are taking place in line with their regular timetable are for seats that were last up in the 2017 round of local elections. This took place while Theresa May was riding high in the opinion polls, and not long after she called a general election in the hope of strengthening her parliamentary majority to deliver Brexit.
One of the key patterns at the 2017 and 2019 general elections was a tendency for those who voted Remain to swing more to Labour than those who voted Leave, while the Conservatives lost ground amongst Remain voters while advancing amongst their Leave counterparts. There has so far been a similar pattern at all the local elections since the referendum, that is those in 2017, 2018 and 2019. In each case, the Labour vote increased more (or fell less) where the Remain vote was higher at the referendum in 2016, while the converse was true of the Conservatives.
The same may happen again this year, especially in those seats that were last contested before the referendum. For those that were last contested in 2017, any such pattern could be weaker – or, equally importantly, maybe the pattern will be reversed now that Brexit has been delivered.
Meanwhile, this year’s local elections are being held in a large proportion of provincial and metropolitan England outside London. Although there are devolved elections in London, Scotland and Wales, the results of those elections do not form any part of the calculation of the PNS, which has always been based solely on the results of local elections in England. Nonetheless, since the PNS is an estimate of what the GB share of the vote would have been had the pattern of local election results been replicated across the whole of GB, the political character of places without local elections still needs to be taken into account in generating the estimates of the PNS.
In particular, Scotland and London voted strongly to Remain the EU, while on average the places in England with local elections voted to Leave. Consequently, if party performance proves to be correlated with the outcome locally of the EU referendum, there is a risk that the average change in each party’s share of the vote will not give an accurate picture of the relative strength of the Conservatives (and Labour) across Britain as a whole. The calculation of the PNS takes this possibility into account.
The process involves analysis of the extent to which party performance in each of the councils where the BBC is collecting the detailed ward by ward voting figures is systematically correlated with the political and social character of those wards, including the Leave share of the vote in 2016. Using a similar approach to that used for the general election exit poll, we will be constructing statistical regression models of the change in each party’s share of the vote, and using these to project the pattern of change in support across all local authorities in Britain, whether they have local elections or not. The resulting estimated changes in party support in each district are then aggregated across Britain as a whole, taking into account the different numbers of electors in each council area. This produces an estimate of what the change in the share of the vote would have been if local elections had been held across the whole of Britain.
This process is undertaken separately for change in party performance from four different baselines. For places holding elections that were postponed from last year change is first and foremost since the 2016 local elections. But it is also possible to calculate change from the 2018 and 2019 local elections if the wards with an election this year also saw elections in those years, as councils which are elected by thirds typically did. In contrast, for the elections where the seats up were last fought in 2017, that is the only baseline we have. They are predominantly county council elections which hold all-out elections every four-years.
For each of the four baselines, the resulting estimate of the overall change in each party’s share of the vote will then be applied to the relevant baseline PNS to generate an estimate of the 2021 PNS. That means we derive four different estimates from four baselines, which ought to be similar but will not necessarily be precisely the same. To take a straight average of the four would be to privilege the results from the 2016 wards, which also have 2018 and 2019 baselines. Instead, we will average the projections from those three baselines, before combining that average with the projection from the 2017 baseline.
Another important feature of the PNS is that, in trying to approximate the circumstances of a general election, it focuses on the performance of the three main parties (that is, the Conservatives, Labour, and the Liberal Democrats) in wards where they compete against each other. Many wards at these local elections will not feature a candidate from one or more of these parties. However, the 45 council areas where the BBC are collecting detailed results this year are all places where all three of these parties contested all or most of the wards in either 2016 or 2017 and are doing so again this year. This is an important foundation behind the claim that the PNS is an estimate of the share of the vote that the principal parties would have won in a GB-wide general election should voters across the country as a whole behave in the same way as those who actually voted in the local elections.
Projecting seats in the House of Commons from the PNS
In what Peter Snow often described as ‘just a bit of fun’, the PNS is also used to estimate the composition of the House of Commons in a contemporaneous general election. This estimate is simply a statement of what the outcome in seats would be if the changes in party support implied by the PNS since the last general election were to be replicated across the country as a whole.
However, we know that the level of party performance in local elections tends to differ somewhat from that in a parliamentary election, even when the two are held on the same day. In particular, the Liberal Democrats tend to perform rather better in local elections, and both the Conservatives and Labour rather worse.
Therefore, in calculating the projected House of Commons, we take into account the difference between each party’s general and local election performances in 2010 and 2015, when local elections were held on the same day as a general election. On average across those two elections the Conservative share of the vote in the local election PNS was 2.3 points lower than in the general election, and the Labour share 2.8 points lower, while the Liberal Democrats’ share was 2.9 points higher and that for all others combined, 2.2 points higher. We can call this the local election performance adjustment.
The forecast House of Commons will then be calculated by applying for each party the following changes in shares of the vote across all constituencies:
2021 PNS – 2019 General Election share – (Party’s local election adjustment)
We also assume that there is no change in SNP and PC support since the 2019 election. This adjustment was first used by the BBC in its coverage of the 2018 local elections.
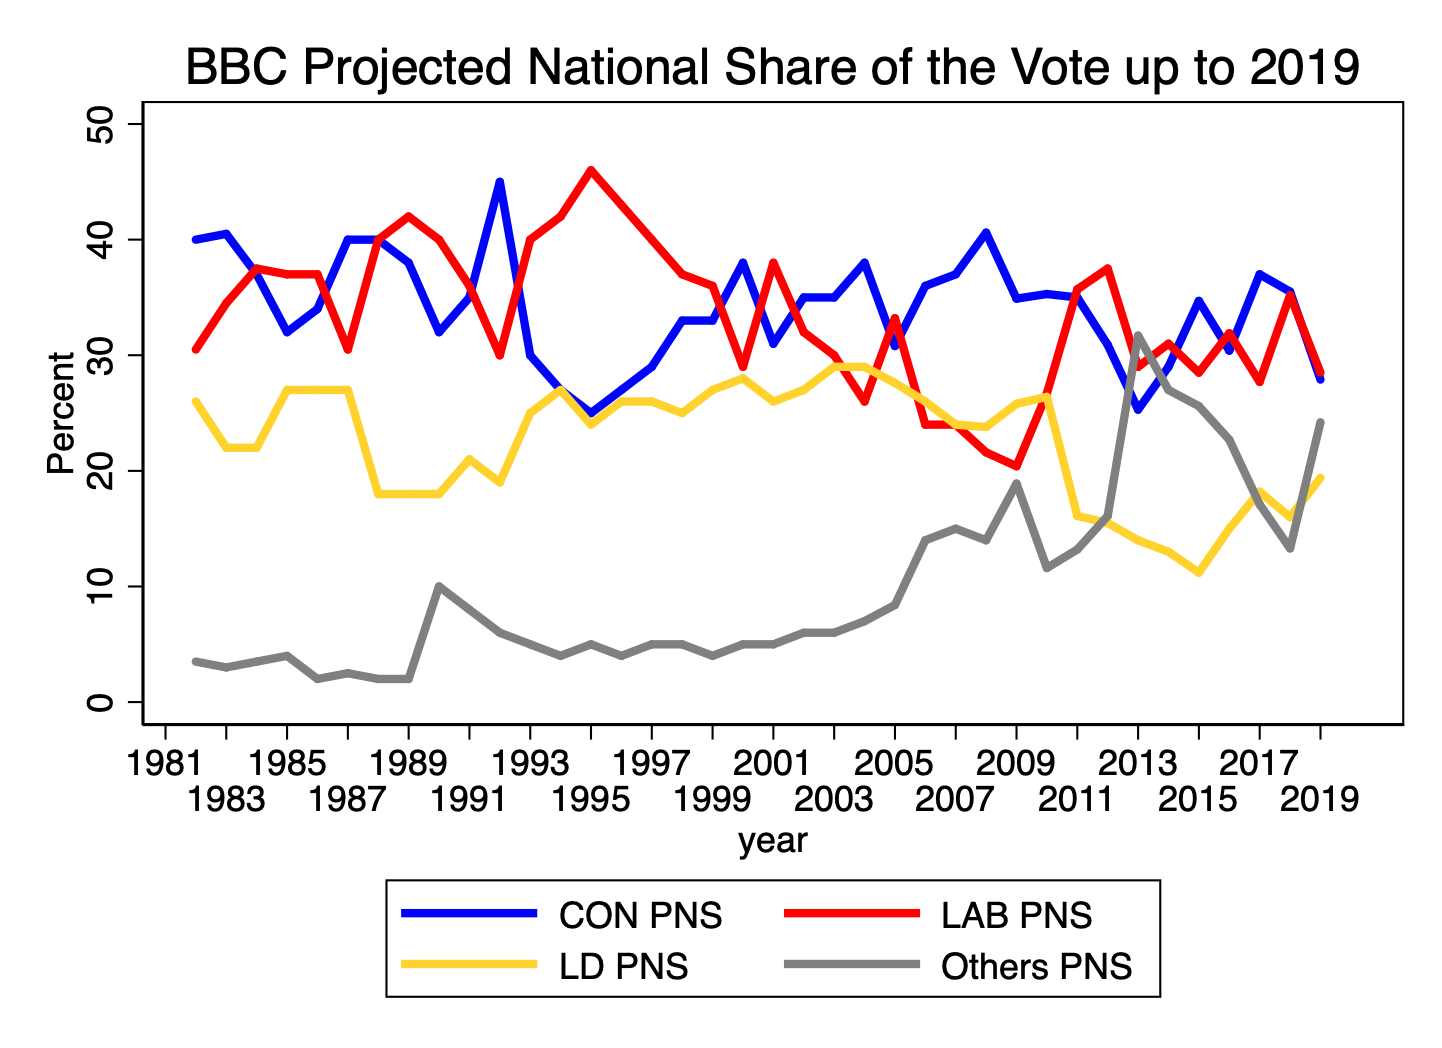
The data used to create the above figure are in the table below. They include a revision to the 2017 estimates from our previously published version.
| Con | Lab | LD | Others | |
| 1982 | 40 | 30.5 | 26 | 3.5 |
| 1983 | 40.5 | 34.5 | 22 | 3 |
| 1984 | 37 | 37.5 | 22 | 3.5 |
| 1985 | 32 | 37 | 27 | 4 |
| 1986 | 34 | 37 | 27 | 2 |
| 1987 | 40 | 30.5 | 27 | 2.5 |
| 1988 | 40 | 40 | 18 | 2 |
| 1989 | 38 | 42 | 18 | 2 |
| 1990 | 32 | 40 | 18 | 10 |
| 1991 | 35 | 36 | 21 | 8 |
| 1992 | 45 | 30 | 19 | 6 |
| 1993 | 30 | 40 | 25 | 5 |
| 1994 | 27 | 42 | 27 | 4 |
| 1995 | 25 | 46 | 24 | 5 |
| 1996 | 27 | 43 | 26 | 4 |
| 1997 | 29 | 40 | 26 | 5 |
| 1998 | 33 | 37 | 25 | 5 |
| 1999 | 33 | 36 | 27 | 4 |
| 2000 | 38 | 29 | 28 | 5 |
| 2001 | 31 | 38 | 26 | 5 |
| 2002 | 35 | 32 | 27 | 6 |
| 2003 | 35 | 30 | 29 | 6 |
| 2004 | 38 | 26 | 29 | 7 |
| 2005 | 31 | 33 | 28 | 8 |
| 2006 | 36 | 24 | 26 | 14 |
| 2007 | 37 | 24 | 24 | 15 |
| 2008 | 41 | 22 | 24 | 13 |
| 2009 | 35 | 20 | 26 | 19 |
| 2010 | 35 | 27 | 26 | 12 |
| 2011 | 35 | 36 | 16 | 13 |
| 2012 | 31 | 38 | 16 | 15 |
| 2013 | 25 | 29 | 14 | 32 |
| 2014 | 29 | 31 | 13 | 27 |
| 2015 | 35 | 29 | 11 | 25 |
| 2016 | 30 | 31 | 15 | 24 |
| 2017 | 37 | 28 | 18 | 17 |
| 2018 | 35 | 35 | 16 | 14 |
| 2019 | 28 | 28 | 19 | 25 |
