
By Stephen Fisher, John Kenny, and Rosalind Shorrocks. 29th May 2024
Pretty well. Whereas many of the forecasts for the 2017 British general election incorrectly pointed to a Conservative majority, and sometimes a large one, in 2019 the general election forecasts correctly suggested a comfortable Conservative majority. But they did not do equally well and there are perhaps lessons to be learned for which forecasting methods might be more prescient than others this year.
During both the 2017 and 2019 election campaigns we published regular updates of forecasts combining other election forecasts. The postmortem for the 2017 combined forecast is here and the final forecasts for 2017 are here. The final forecasts for 2019 are here. The experience of a combined forecast for the 2016 Brexit referendum is discussed here.
The idea of the Combined Forecast is inspired by the PollyVote site and the work of Andreas Graefe. The rough idea is to combine different kinds of forecasts of an election in the hope that the average of the forecasts will tend to be better than any particular method. We also think that comparing different kinds of forecast systematically provides some insights into how they behave and the range of relatively likely election outcomes. Forecasts can be combined in different ways. We average over forecasts within each category (polls, betting markets, models, etc.) before averaging across categories.
The figure below shows predictions of the Conservative lead over Labour in the share of the vote over the course of the 2019 campaign from an expert survey, betting markets, forecasting models, and opinion polls. They all anticipated a big Conservative lead, but one short of the eventual 12-point Tory lead. It is common for the Conservatives to outperform the polls and Labour to fall short of their polling figures. That happened again in 2019. Polls, betting markets and models all performed similarly well on average. Differences between models and pollsters are discussed below.

The figure below shows that all the forecasting methods underestimated the eventual number of Conservative seats. Simple models (uniform change based on GB vote-intention polls) performed best on average across the campaign and better than more complicated models (including Multilevel Regression and Post-stratification (MRP) models) and betting markets in the final forecast.

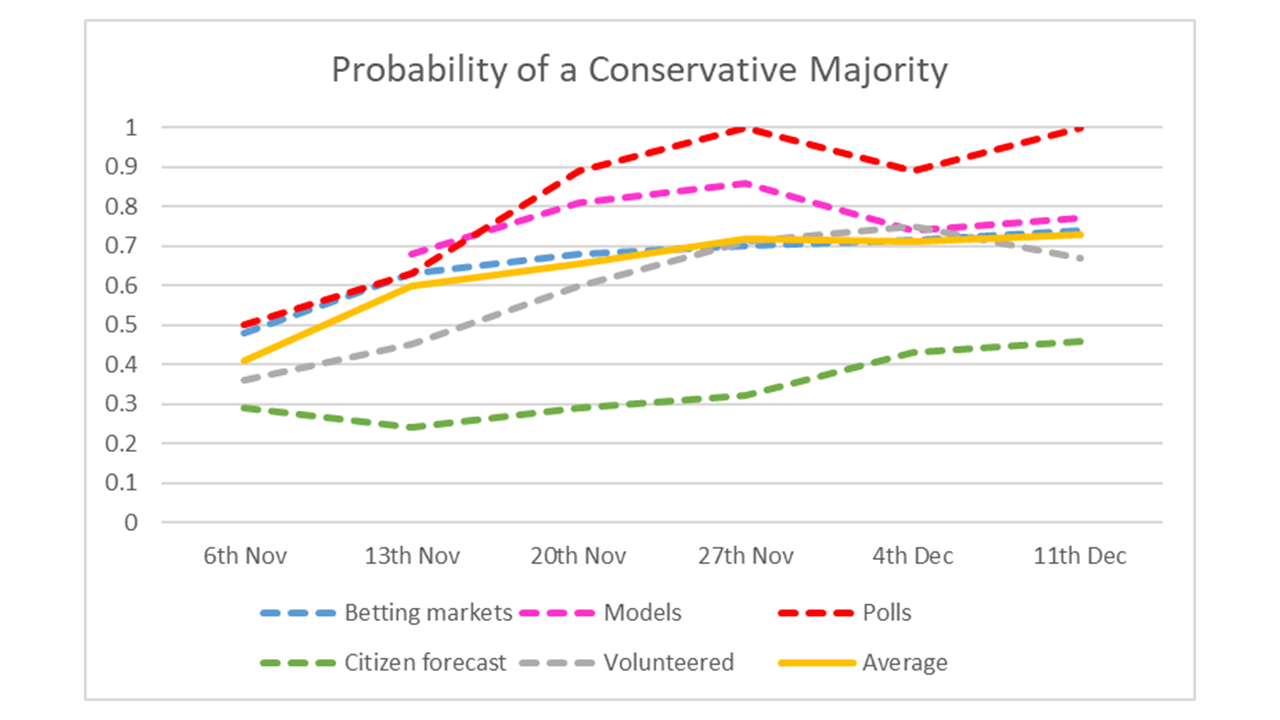
The figure below shows the predicted probabilities of a Conservative majority over the course of the 2019 campaign. Whereas probabilities from models and the betting markets are clear from those sources, the figures for citizen forecasts and opinion polls are more implied or pseudo probabilities. The apparent high level of confidence in a Conservative majority from the polls simply reflected the proportion of pollsters that showed the Conservatives commanding a sufficient lead for a majority of seats based on uniform change calculations. The relatively small proportion of citizens who predicted a Conservative majority, as shown by the green line, is striking, especially when other indicators were suggesting a comfortable majority was likely. In part this may be due to the ways in which the survey questions were worded.
The table below shows final polls and uniform change projections of seats from the polls. The final line gives the actual vote shares and seats. Since Opinium vote shares were the same for the three main parties as the eventual vote shares, comparing the seat projection for Opinium with the actual result shows that the Conservatives slightly outperformed uniform change, but not by much. (Just 5 seats by this measure, but see also the freely downloadable Appendix to the Nuffield election study book for a different approach.) This is one reason that the pollsters should not be judged on the projections.
Table of final polls and uniform change projections
| % Vote share | Uniform change projections | ||||||||
| Con | Lab | LD | Con-Lab lead | Con majority | Con | Lab | LD | SNP | |
| ComRes | 41 | 36 | 12 | 5 | 8 | 329 | 238 | 19 | 42 |
| ICM | 42 | 36 | 12 | 6 | 16 | 333 | 235 | 19 | 41 |
| BMG | 41 | 32 | 14 | 9 | 30 | 340 | 225 | 21 | 42 |
| YouGov | 43 | 34 | 12 | 9 | 36 | 343 | 225 | 19 | 41 |
| Panelbase | 43 | 34 | 11 | 9 | 38 | 344 | 225 | 18 | 41 |
| Average | 43 | 34 | 12 | 9 | 40 | 345 | 224 | 18 | 41 |
| Deltapoll | 45 | 35 | 10 | 10 | 48 | 349 | 221 | 16 | 42 |
| Ipsos MORI | 44 | 33 | 12 | 11 | 56 | 353 | 216 | 18 | 41 |
| Survation | 45 | 34 | 9 | 11 | 54 | 352 | 218 | 16 | 42 |
| Kantar | 44 | 32 | 13 | 12 | 68 | 359 | 209 | 19 | 41 |
| Opinium | 45 | 33 | 12 | 12 | 70 | 360 | 209 | 18 | 41 |
| Qriously | 43 | 30 | 12 | 13 | 72 | 361 | 207 | 19 | 41 |
| Actual | 45 | 33 | 12 | 12 | 80 | 365 | 203 | 11 | 48 |
The Conservative lead in the final polls varied from 5 points for ComRes (only just enough for a majority on uniform change projections) to 13 points for Qriously (the only pollster to overestimate the Conservative lead over Labour in 2019 and the only one to estimate Labour would win more votes than the Conservatives in 2017). The average pollster underestimated the Conservative lead by some 3 percentage points. Thus, uniform change projections from the average of the polls underestimated the number of Conservative seats by 20, of with 15 were due to underestimating the lead.
Of those that used more sophisticated statistical models to forecast the 2019 election, the only one to have a component anticipating a pro-Labour bias in the final polls, Nigel Marriott, was the closest.
The table shows all the model-based forecasts for seats ordered by the number of Conservative seats. In general, the better seats forecasts were the ones with better estimates of the share of the vote and projections relatively close to uniform change.
| Con | Lab | LD | SNP | PC | Greens | |
| PM and Pendulum: Lebo and Fisher | 311 | 268 | ||||
| PSA Expert Survey | 324 | 233 | 25 | 42 | 4 | 2 |
| Prosser and Fisher (local elections based) | 329 | 231 | 23 | |||
| 326 politics | 336 | 230 | 17 | 44 | ||
| PME Politics & Bailey | 337 | 228 | 17 | 44 | 4 | 1 |
| Best for Britain/Focaldata | 337 | 235 | 14 | 41 | 3 | 1 |
| YouGov MRP | 339 | 231 | 15 | 41 | 4 | 1 |
| Party Leadership Model (Murr) | 342 | 254 | ||||
| Opros | 343 | 211 | 27 | 46 | 3 | 1 |
| Datapraxis MRP | 344 | 221 | 14 | 47 | 4 | 1 |
| UNS from Poll Average | 345 | 224 | 18 | 41 | 3 | 1 |
| Betting markets average | 346 | 221 | 18 | 43 | 4 | 1 |
| Electoral Calculus | 348 | 227 | 13 | 41 | 2 | 1 |
| UKElect | 348 | 217 | 17 | 44 | 4 | 1 |
| PM and Pendulum: Norpoth | 352 | 228 | ||||
| Principal Fish (uniform change based) | 354 | 214 | 18 | 41 | 3 | 1 |
| Forecast UK (Peter Ould) | 358 | 203 | 20 | 46 | 4 | 1 |
| Citizens: Murr, Stegmaier and Lewis-Beck | 360 | 190 | 16 | |||
| Actual | 365 | 203 | 11 | 48 | 4 | 1 |
| Nigel Marriott | 366 | 200 | 12 | 49 | 3 | 1 |
| Average | 343 | 225 | 18 | 44 | 3 | 1 |
The Murr, Stegmaier and Lewis-Beck citizens’ forecast model did well, but that is not the same thing as saying that the citizens called the election accurately. As discussed above, on average across relevant polls, less than half the voters thought the Conservatives would get a majority.
Perhaps the key reason why the famous 2017 YouGov MRP model did well was that it estimated just a four-point lead for the Conservatives: close to the 2.5 point lead that transpired, and much less than many other polls in that campaign. By contrast, the 2019 YouGov MRP model did not do so well partly because it estimated that the Conservatives would slightly underperform, and Labour overperform, a uniform change given the estimated GB vote share from the model. It should have been the other way round. But more importantly, along with the average of the polls in 2019, the YouGov MRP model estimated a 9 point lead for the Conservatives instead of a 12 point lead. That underestimation of the Conservative lead was the main source of error for the 2019 YouGov MRP model.
Conclusion
In general, 2019 seems to have confirmed an important lesson from previous elections: uniform change projections are not a bad guide to seat outcomes if you know what the GB share of the vote will be. Even though estimating the GB share of the vote correctly is difficult, pollsters still tend to provide a better guide to the outcome than betting markets and other election forecasting methods.

What is also interesting about both tables is not only was Nigel Marriot closest to the national outcome for UK wide parties he also predicted the SNP seat share more accurately that the polling companies who consistently underestimated the SNP in Scotland. Getting Scotland right requires different polling analysis methodology to the use of UK wide polling only.