
The graph below shows the BBC Projected National Share of the vote (PNS) from local elections together with general election vote intention from the polls for the month before each round of local elections.
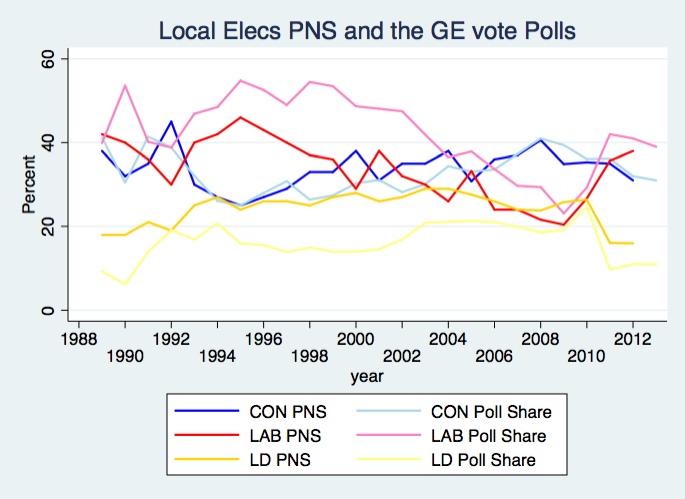
There are some signs that they are tracking each other, but not that closely. (The correlations are about 0.7). There are clear systematic differences with Labour doing much better in the polls than in the PNS (with very big gaps during Blair’s leadership up to the Iraq war: 1994-2003). Also, the Liberal Democrats have consistently done better in local elections than in the polls, except when local elections are on the same day as general elections.
The poll lines continue for 2013. They show relatively little change since 2012, so perhaps there won’t be much change in the PNS either today? But last year UKIP were only contesting around a third of seats and there wasn’t so much hype in the media about them.
Acknowledgements
Thanks to Michael Thrasher and John Curtice for help with the data.
