By Stephen Fisher, John Kenny and Rosalind Shorrocks
Since our update last week there have been several new forecasts, most notably including the YouGov MRP (multilevel regression and post-stratification) model. That was a nowcast rather than a forecast, but the same is true of most of our “forecasts”. More on differences between forecasting models below, along with some observations about intriguing question wording effects for citizen forecasts.
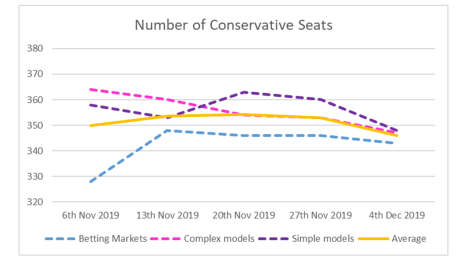
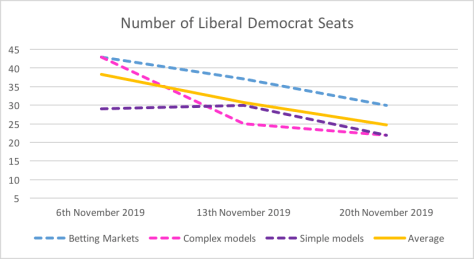
But first, overall, the seats projections overall have tightened for the Conservatives, who are down from a 353 average last week to 346 this week, while Labour are up from 209 to 218. The Liberal Democrat forecast total has dropped yet again (from 23 to 19). Now they are estimated to return fewer MPs than they had going into the election (20), but still more than the number of seats they won in 2017 (12).
| Seats | Betting Markets | Complex models | Simple models | Average |
| Con | 343 | 347 | 348 | 346 |
| Lab | 220 | 218 | 217 | 218 |
| LD | 19 | 18 | 19 | 19 |
| Brexit | 0 | 0 | 0 | |
| Green | 1 | 1 | 1 | 1 |
| SNP | 45 | 45 | 44 | 45 |
| PC | 5 | 4 | 3 | 4 |
| Con majority | 36 | 45 | 46 | 42 |
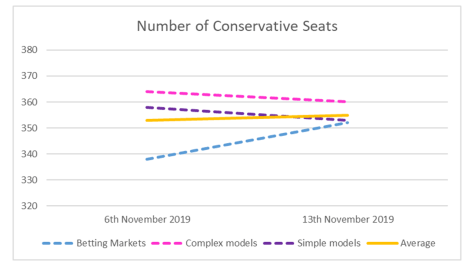
There is now remarkably little difference between the betting markets, complex and simple models in the expected size of the Conservative majority. Particularly striking is that on average the complex models differ by only a seat for each party from the simple uniform change projections based on the average of the opinion polls.
Continue reading Fifth combined forecast for the 2019 general election
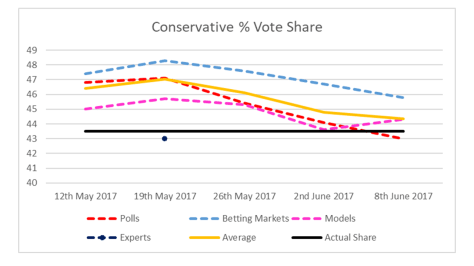 Note: Due to an error in our 2ndJune 2017 betting market calculation (and no way of correcting it at this stage) the betting market line runs direct (interpolates) from 26thMay to the final 8thJune 2017 estimate.